
Dashboard, Reports & Analysis in HP ALM
 Thomas Hamilton
⚡ Smart Summary
Dashboard and reporting features in HP ALM (Quality Center) turn raw project data into graphs, Excel reports and project reports, giving testers and stakeholders a live picture of quality across requirements, tests and defects.
The Dashboard module in HP ALM (Quality Center) is where test data becomes decision-ready information. It holds two views — Analysis View for building graphs and reports, and Dashboard View for arranging those graphs on a single page.
- ALM allows users to generate reports and graphs at any time during the software development process.
- Project reports in ALM enable users to design and generate customized report by accessing the project information which will help stakeholders in taking informed decisions.
- User can create graphs or project reports in the Analysis View module. They can also save the graphs and reports in the Analysis View module for future references.
Version note: HP ALM passed to Micro Focus and is now sold as OpenText ALM / Quality Center. The Dashboard workflow shown below is unchanged; later releases simply add Composite, Trend, Cycle Time and Anomalies graph types.
The screenshot below shows the Dashboard tab and the two views it exposes.

Analysis View
Analysis view module enables users to create, manage and view analysis items such as graphs, project reports and Excel reports.
Entity Graph: ALM enables users to generate graphs based on certain entity type such as requirements, tests, test instances, test runs or defects. For each entity, different graph types are available that are listed below.

Most commonly used graphs are
- Requirement Coverage Graph
- Requirement Summary Graph
- Test Set Summary Graph
- Defect Progress Graph
- Defect Summary Graph
- Defect Age Graph.
Now, Let us generate an Entity Graph based on ‘Defect Summary’ criteria.
Step 1) Navigate to ‘Dashboard’ Tab.
- Select Analysis View
- Click ‘New’.
- Select ‘Graph Wizard’

Step 2) Let us generate ‘Entity Graph’. We can also generate a Business View Graph and click ‘Next>’.

Step 3) The “Select Entity Type” Dialog is displayed to the user.
- Select the entity for which the Graph has to be displayed
- Select the Graph type.
- Click ‘Next’.

Step 4) The Wizard also allows you to choose projects. The user has capabilities to add the same graph configuration across projects.

Step 5) The Wizard also allows you to enter a filter criterion. If there is NO Filter applied, the graph is generated by considering all the data available in Defects module.
Note: Filter can be applied against a specific release/cycle. If NO Filter is set, the graph wizard picks up all the defects that are posted till date into consideration.

Step 6) The Wizard allows user to choose X-Axis and Group by a certain field and click ‘Finish’.

Step 7) The graph is generated as per the criteria set by the user in Graph wizard. We can ‘Add it to the Analysis Tree’ so that we can just refresh the chart to get the current status.

Step 8) Upon clicking on ‘Add to Analysis Tree’ the save dialog opens up.
- Enter the Name of the Graph
- Select the folder where user would like to save the Graph
- Private – The Graph is saved against the current user profile. Others won’t have access to the same
- Public – The generated Graph would be visible to ALL the project users.
- Click ‘Save’.

Step 9) The graph would be added to the Analysis tree as shown below.

Entity graphs cover one record type at a time. When a question spans linked records, ALM offers a second graph kind.
Business View Graph
A business view graph involves only those project entity fields that represent information which is useful from a business perspective.
Business views can either be based on single entities such as Requirement or Defects, or it can be based on more complex relationships between entities such as Defects with Linked Requirements/defects with linked tests.
Though on a high level, both business view graph and entity graph look at the same, at this juncture let us understand basic different between entity graph and business view graph.
| Entity Graph | Business View Graph |
|---|---|
| This graph is strictly associated with only one type of entity (defect or Requirement or Test) in ALM | This Graph is either based on single entity or based on relationship between Defect and Requirement or defect and tests |
| The fields involved are those that are contained within that specific entity. | The fields involved are those that represent useful information from a business perspective. |
Step 1) Click ‘+’ and Select ‘Graph Wizard’.

Step 2) Select Business View Graph and click ‘Next>’

Step 3) Select Defects from the Filter criteria and click ‘Next>’.

Step 4) Use the current project data to generate the graph and click ‘Next>’ to continue.

Step 5) Let us filter based on Severity and click ‘Next>’

Step 6) Enter the criteria for ‘X-Axis’ and Grouped By fields and Click ‘Finish’

Step 7) The Graph is Generated based on the Criteria selected. Click on ‘Add to Analysis Tree’.
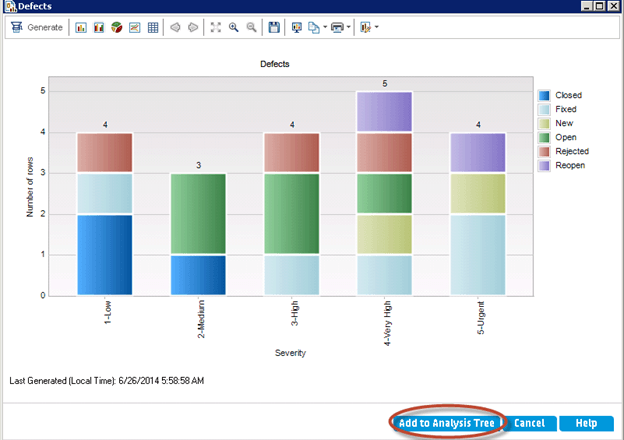
Step 8) The save dialog appears for users to save the generated graph.
- Enter the Name of the Graph
- Select ‘Private’ or ‘Public’
- Click ‘Save’.
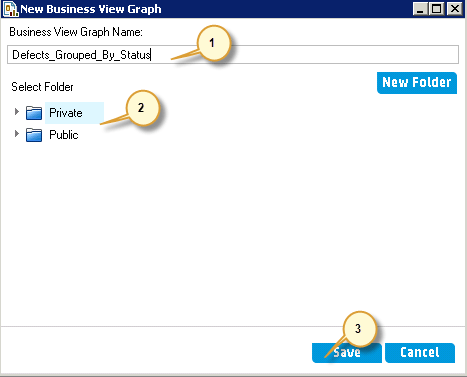
Step 9) The created graph is saved in Analysis Tree as shown below.

Both graphs above went through the wizard. ALM also exposes a shorter route for everyday charts.
Quick Entity Graphs Generation
Step 1) The Entity Graph can also be generated without going through the Graph Wizard. A Quick Graph can be generated by clicking on ‘New Graph’ by clicking on ‘+’ icon.

Step 2) The New Graph dialog is displayed.
- Select the Entity
- Graph Type
- Graph Name
- Click ‘OK’.

Step 3) The Created Graph enables users to make changes to the Configuration based on their requirements. We have selected defect Count on Y Axis and Grouped based on ‘Status’.

Step 4) Click ‘View’ Tab to generate the Graph for the specified criteria.

Graphs answer visual questions. For row-level analysis, ALM pushes the same data into Microsoft Excel.
Generating Excel Report
- Testers can also generate Excel reports based on business views which reflect only those project entity fields that is useful from a business perspective.
- The reports are created and configured with in Microsoft Excel and then uploaded to the Analysis View module.
Step 1) Click ‘Add New’ Button and select ‘New Business View Excel Report’.

Step 2) Enter the report name and click ‘OK’.

Step 3) Click ‘Install Addin’.
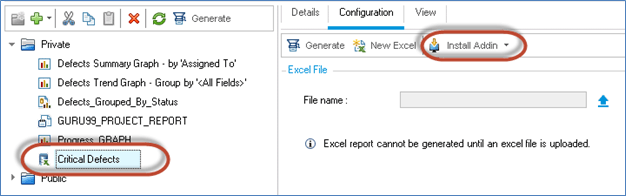
Step 4) The Installation Status is displayed to the user as shown below.

Step 5) OpenMS Excel and one would find a new Tab by name ‘HP ALM’. Select ‘HP-ALM’ and click ‘Login’

Step 6) ALM Login Dialog opens up.
- Enter Login Name.
- Enter Password.
- Click ‘Authenticate’.
- Select the Domain.
- Select the Project.
- Click ‘Login’.

Step 7) Now,
- Click ‘Add’ Button.
- Add Worksheet Dialog Opens up. Select ‘Defects’ as we want to generate ‘High’ / ‘Very High’ and ‘Critical’ defects report.
- Click ‘OK’

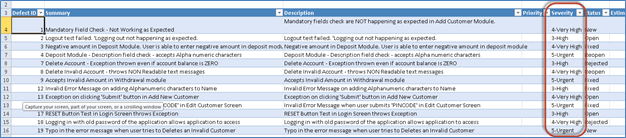
Step 7) The Excel report is generated with all the defects list and user can configure the same.
- Click ‘Filter’ Tab from Worksheet configuration.
- Click ‘Severity’ Field.

Step 8) The ‘Select Filter Condition’ dialog opens up.
- Select the Filter condition
- Click ‘OK’

Step 8) Now we need to save the same against the excel report that we have created.
Click ‘HP ALM’ tab and click ‘Save to ALM’.

Step 9) The ‘Save Business View Excel Report’ Dialog Opens up.
- Enter the Report Name
- Select the same report that we created in Step 2.
- Click ‘Save’.

Step 10) Confirm Save Dialog box opens up. Click ‘Yes’ to Continue. This dialog pops up as user is trying to overwrite with the one that is already created.
Note: The ALM asks for overwriting the existing excel report as we have selected the same report name that we have created in Step 2. In Step 2 the report was NOT configured and loaded but it was just a placeholder for the report. Only after performing this step the excel report is available for the user to generate and save in excel format.

Step 11) Now user can generate the report from ALM. Click ‘Generate’.

Step 11) Now report displays based on the criteria set by the user.
Note: User can get the updated report by regenerating the excel report, if there is an addition or deletion of defects or if there is a change in the severity of the defect.
Excel suits ad-hoc slicing, while a formal document for review boards needs the project report builder.
Generating Project Report
- Project reports enable users to design and generate detailed reports containing information for a specific project.
- Users can also define sections and sub-sections each listing records of a specified ALM entity.
- Users can customize the layout and the template format for each section.
- The Project report can be generated as HTML, Microsoft Word, or PDF formats.
Step 1) To Create a new project report, click ‘+’ icon from Analysis Module and select ‘New Project Report’.

Step 2) The new project Report Dialog box opens. Enter the Name of the Project and Click ‘OK’.

Step 3) The changes are reflected in the screen as shown below
- The Project Report is created.
- Click ‘Add Report Section Button.
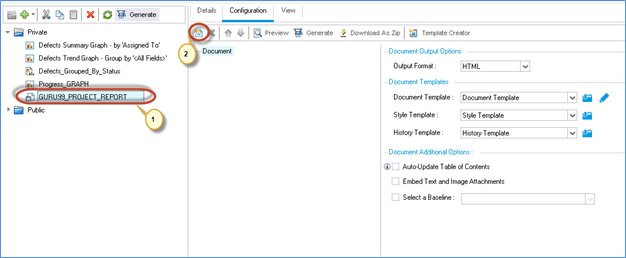
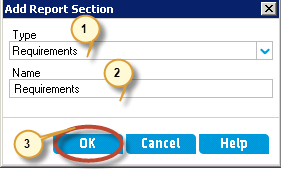
Step 4) The add report section dialog is displayed.
- User has to enter the type of section that they would like to include
- Enter the name of the Section
- Click ‘OK’.
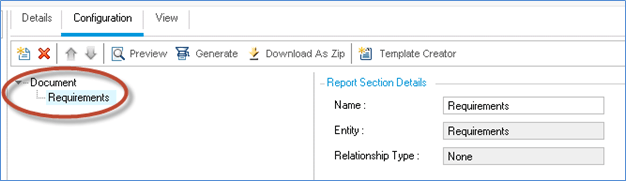
Step 5) The Requirement section is now added to the report.
Step 6) Now we will add test report section.
- Click ‘Add Report Section’.
- Select ‘Type of Report’ to be inserted from ‘Add Report Section’ dialog
- Enter the name of the report section.
- Click ‘OK’.

Step 7) The report section with the name ‘Tests’ would be added as shown below.

Step 8) Similarly create a section for defects and the final report layout will be as shown below. Once added click ‘Generate’ button.

Step 9) The report would be generated by connecting to server.

Step 10) The project report would be generated as specified by the user. User can save the project report from the generated window. If the generated format is a doc or docx, it can be saved from MS word. If the selected file format is HTML, save it from the appropriate browser. If the generated report is in PDF format, save it from PDF reader.

Once graphs are saved to the analysis tree, the Dashboard View gathers them into one status page.
All About Dashboard
- This module helps users to design a dashboard page by selecting and arranging graphs on the page based on their requirements.
- This module is very helpful for stakeholders/project managers to get a quick snapshot about the project status.
Step 1) To Create a Dashboard page,
- Click Dashboard View
- Click ‘New Dashboard Page’ icon
- New Dashboard Page dialog opens. Enter Name of the Dashboard Page.
- Click ‘OK’.

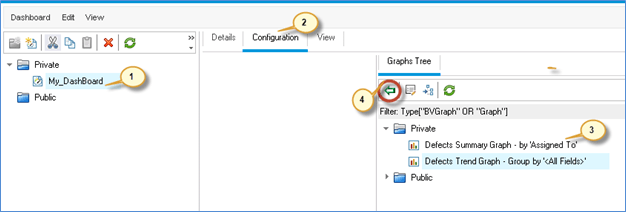
Step 2) Thecreated dashboard is displayed as shown below.
- The created Dashboard page
- Click ‘Configuration’.
- Graph Tree is displayed from where user can select all the graphs
- Add it to the dashboard page by clicking on “<=” Button.
Step 3) The configuration should now display the selected graphs.

Step 4) Select the View Tab to display the selected graph.

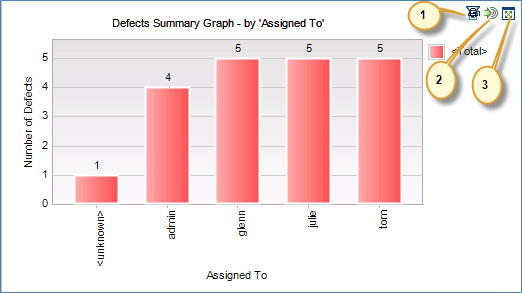
Step 5) Let us understand the icons that appear on the right hand side of each one of the graphs.
- Generate Graph – Generates/Refreshes the Graph after changes.
- Go to Graph Analysis Tree – From Dashboard, it takes user to the Analysis Tree.
- View Graph in Full Screen – Displays the graph in full screen mode.
Video on Graphs
Click here if the video is not accessible
