Power BI Tutorial
⚡ Smart Summary
Power BI is Microsoft’s business intelligence and data visualization platform that converts raw data from many sources into interactive dashboards and reports. It spans Desktop, Service, and Mobile apps and now operates inside Microsoft Fabric.

Before we understand Power BI, let us first learn about business intelligence:
What is BI?
Business intelligence (BI) is a technology-driven method which helps you to analyze data and to provide actionable information. This information helps corporate executives, business managers, and other users to make informed business decisions.
What is Power BI?
Power BI is a Business Intelligence and Data Visualization tool for converting data from various data sources into interactive dashboards and analysis reports. Power BI offers cloud-based services for interactive visualizations with a simple interface for end users to create their own reports and dashboards.
Different Power BI versions like Desktop, Service-based (SaaS), and mobile Power BI apps are used for different platforms. It provides multiple software connectors and services for business intelligence. Power BI is also part of Microsoft Fabric, which we cover later in this article.
In this Power BI training, you will learn all the important concepts of Power BI and develop a foundational understanding of how to use the Power BI tool.
History of Power BI
Here are the key milestones in the evolution of Power BI:
- Power BI was conceptualized by Thierry D’Hers and Amir Netz of the SQL Server Reporting Services team at Microsoft.
- It was originally designed by Ron George in 2010 and named Project Crescent.
- In 2011, it was bundled with SQL Server, codenamed Denali.
- Microsoft unveiled the first public preview, called Power BI for Office 365, in September 2013.
- The first general release of Power BI arrived on 24 July 2015. It was based on Excel add-ins like Power Query, Power Pivot, Power View, and Power Map.
Why use Power BI?
Here are the most prominent reasons to use the Power BI tool:
- Pre-built dashboards and reports for SaaS solutions
- Power BI allows real-time dashboard updates.
- Offers secure and reliable connections to your data sources in the cloud or on-premises
- Power BI offers quick deployment, hybrid configuration, and a secure environment.
- Allows data exploration using natural language queries
- Offers dashboard visualization features that are regularly updated with the community.
Who uses Power BI?
Important professionals who use the Power BI tool include:
- PMO – Project and Portfolio Managers
- Business & Data Analysts
- Developers & Database Administrators
- IT Teams and IT Professionals
- Consumers of end-user reports
- Data Scientists
Types of Power BI tools
Now in this Power BI desktop tutorial, we will learn about the types of Power BI tools.
Some important Power BI tools are:
Power BI Desktop
Power BI Desktop is the primary authoring and publishing tool for Power BI. Developers and power users use it to create brand new models and reports from scratch.
Costs: Free
Power BI service
Online Software as a Service (SaaS) where Power BI data models, reports, and dashboards are hosted. Administration, sharing, and collaboration happen in the cloud.
Pro license: $14/user/month
Power BI Data Gateway
Power BI Data Gateway works as the bridge between the Power BI Service and on-premises data sources using DirectQuery, Import, and Live Query connections. It is installed by a BI Admin.
Power BI Report Server
It can host paginated reports, KPIs, mobile reports, & Power BI Desktop reports on-premises. It is updated every 4 months and installed/managed by the IT team. The users can modify Power BI reports and other reports created by the development team.
Power BI Mobile Apps
The Power BI mobile app is available for iOS and Android (the dedicated Windows mobile app was retired in 2021). It can be managed using Microsoft Intune. You can use this tool to view reports and dashboards on the Power BI Service or Report Server.
Power BI License Comparison
Each tool above is unlocked by a different license. Power BI Desktop remains free, but sharing reports in the cloud requires a paid per-user license or an organization-wide capacity. The table below reflects Microsoft’s pricing as of 2025; always confirm current rates, as prices change.
| License | Cost (per user/month) | Best for |
|---|---|---|
| Free | $0 | Individual analysis and report authoring in Power BI Desktop |
| Power BI Pro | $14 | Publishing, sharing, and collaborating on reports in the Power BI Service |
| Premium Per User (PPU) | $24 | Larger semantic models, more frequent refreshes, and advanced features |
| Microsoft Fabric capacity (F SKUs) | Capacity-based pricing | Organization-wide deployment; replaces the retired Premium per-capacity (P) SKUs |
💡 Tip: You can learn everything in this article with the free Desktop tool alone; a paid license is only needed to publish and share reports.
Data sources for Power BI
Power BI connects to hundreds of data sources. The most common ones are summarized below:
| Data source | Description |
|---|---|
| Excel (.xlsx, .xlsm) | A workbook can have data entered manually or data which is queried and loaded from external data sources. |
| Comma Separated Value (.csv) | Files are simple text files with rows of data. Every row can contain one or more values, separated by commas. |
| Power BI Desktop (.pbix) | You can use Power BI Desktop to query and load data from external data sources. |
| Databases in the Cloud | It allows you to connect live to Azure SQL Database, Azure Synapse Analytics (formerly Azure SQL Data Warehouse), etc. |
| Databases on-premises | You can connect directly to SQL Server Analysis Services relational model databases. An on-premises data gateway is required. |
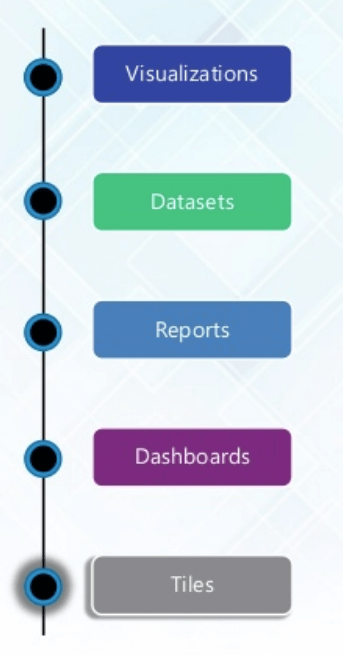
Key terms used in Power BI
The image and table below explain the vocabulary you will meet on every Power BI screen:
| Term | Description |
|---|---|
| Visualization | A visual display of information to achieve one or more objectives. It offers a single-screen display of information and alerts users on issues or problems: operational, performance, personal, etc. |
| Datasets (semantic models) | A dataset is something which you import or connect to. Datasets can be renamed, refreshed, removed, and explored. In Microsoft Fabric, datasets are now called semantic models. |
| Dashboard | The dashboard is a collection which contains zero or more tiles and widgets. It is used to represent a customized view of some subset of the underlying datasets. |
| Reports | A Power BI report is one or multiple pages of visualizations. It can be created from scratch, pinned to a dashboard, and created using datasets. |
| Tile | It is a single visualization found in a report or on a dashboard: a rectangular box which contains each visual. |
Architecture of Power BI
The diagram below shows the three stages of the Power BI architecture:
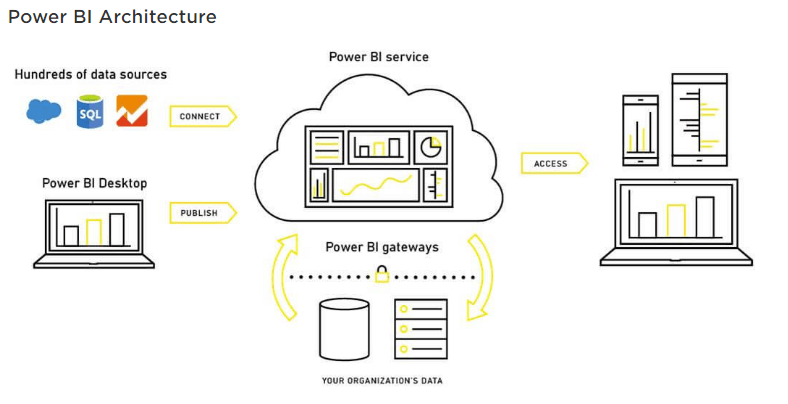
Data Integration
An organization needs to work with data which comes from different sources and can be in various file formats. The data should be extracted from different sources, which can be different servers or databases. This data is integrated into one standard format in a common staging area.
Data Processing
In this stage, the integrated data is still not prepared for visualization because the data needs processing. This data is pre-processed: for example, redundant values and missing values are removed from the data set.
Business rules should be applied to the data once it is cleaned. You can then load that data back into a Data Warehouse.
Data Presentation
Once the data is loaded and processed, it can be visualized much better with the various visualizations that Power BI has to offer. Using dashboards and reports helps represent data more intuitively. These visual reports help business end users to make business decisions based on the insights.
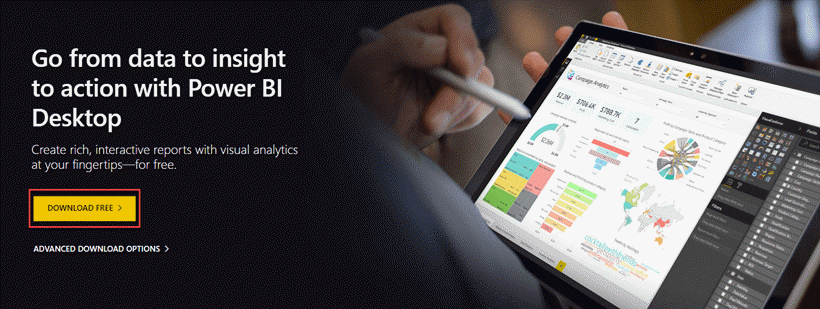
Install and run Power BI Desktop
Step 1) Visit https://powerbi.microsoft.com/en-us/desktop/
And select the Download free button
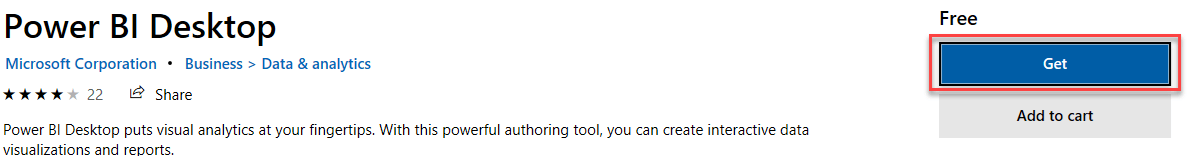
Step 2) You will be redirected to the Microsoft Store. Select the Get button.
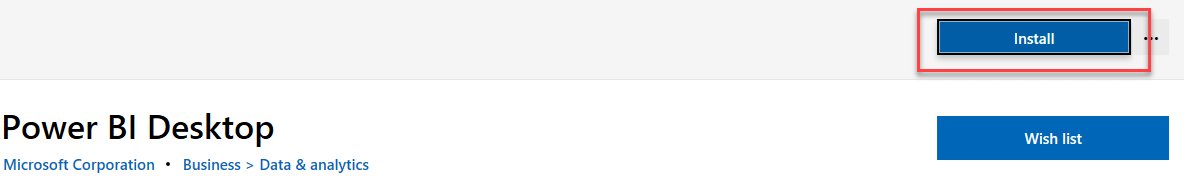
Step 3) Click on the Install button.
Step 4) You can see the progress status on the screen.

Step 5) Before the welcome screen, you will be asked to register or sign in.
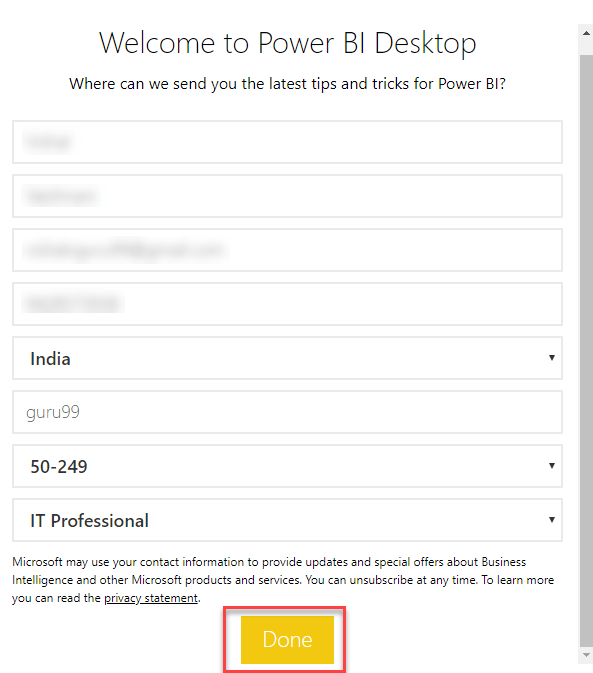
Step 6) When you run Power BI Desktop, a Welcome screen is displayed.
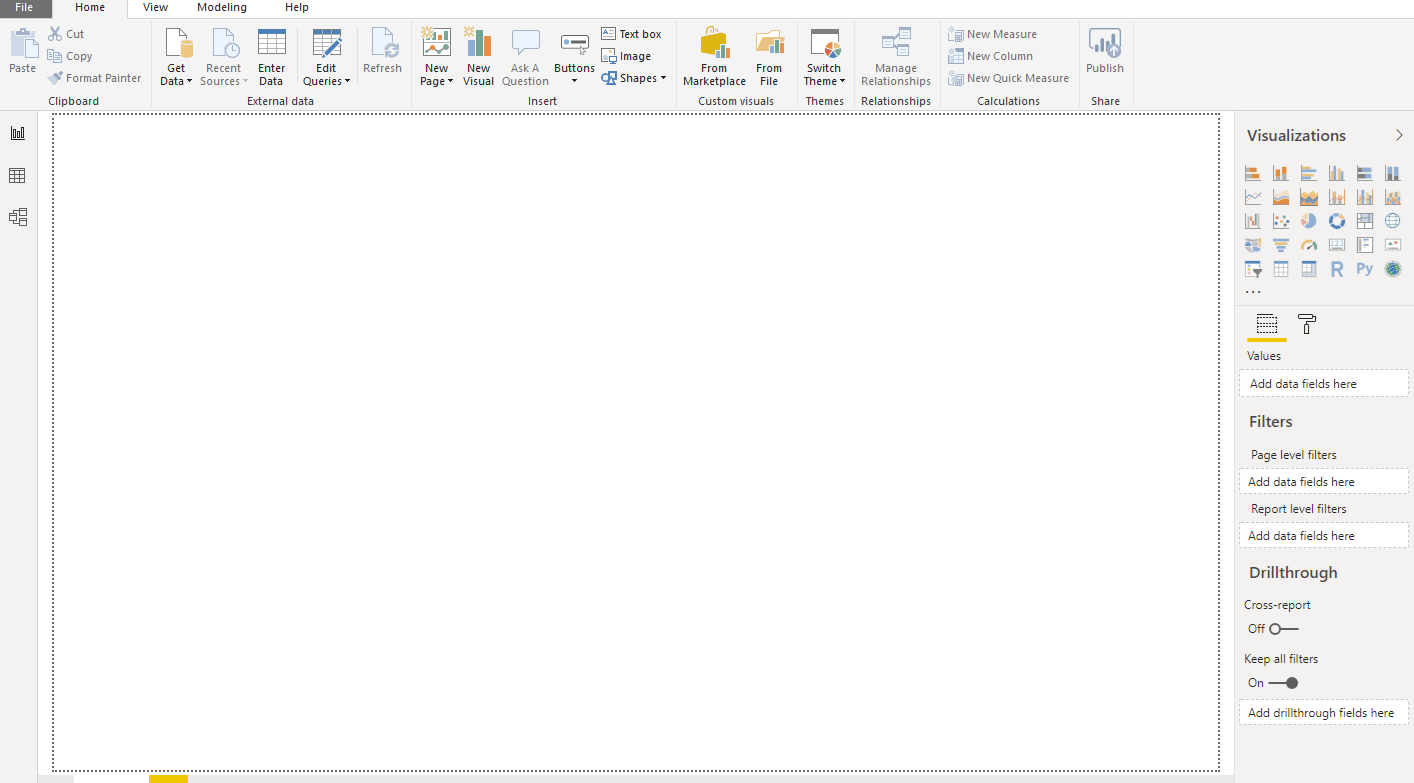
How to create your first report in Power BI Desktop
With Power BI Desktop installed, you can build a working report in minutes:
- Get data: On the Home ribbon, click Get Data and pick a source such as an Excel workbook or a CSV file, then select the tables you need in the Navigator window.
- Transform the data: Click Transform Data to open Power Query Editor. Remove blank rows, rename columns, and fix data types, then choose Close & Apply.
- Model the data: Switch to Model view and confirm the relationships between tables. Power BI detects matching columns automatically, but you can drag fields to create relationships manually.
- Build visuals: In Report view, drag fields from the Data pane onto the canvas and pick a chart type from the Visualizations pane, such as a bar chart for comparisons or a line chart for trends.
- Add slicers and filters: Insert a slicer visual so readers can filter by date, region, or product, and use the Filters pane to limit what each page displays.
- Save and publish: Save the file in .pbix format. With a Pro license, click Publish to push the report to the Power BI Service and share it with colleagues.
💡 Tip: Microsoft’s free financial sample workbook is ideal for practicing these steps before you work with your own company data.
Power BI Dashboard
The figure below demonstrates a Power BI Dashboard:
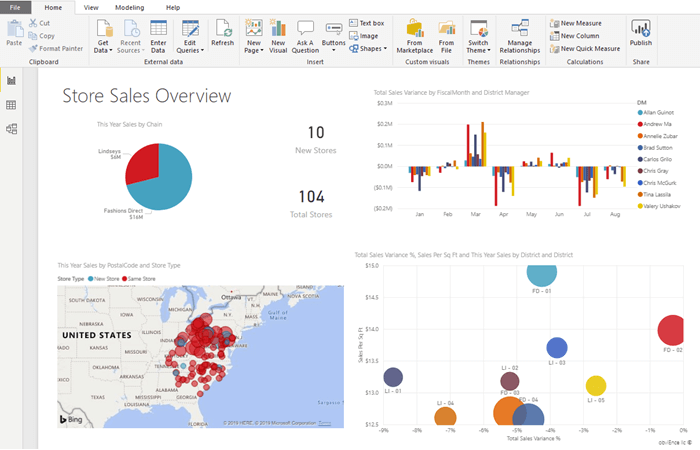
Power BI Desktop is a development tool used to generate dashboards and reports. Power BI applications can be accessed by other users through desktop and mobile devices.
Power BI builds on the following key components:
- Power Query: It can be used to search, access, and transform public and/or internal data sources.
- Power Pivot: It is used for data modeling for in-memory analytics.
- Power View: This component allows you to visualize, analyze, and display data.
- Power Map: It brings data to life with interactive geographical visualization.
- Power BI Service: It allows you to share data views and workbooks, which you can refresh from on-premises and cloud-based data sources.
- Power BI Q&A: It allows you to ask questions and get immediate answers using a natural language query.
- Data Management Gateway: It offers periodic data refreshes, viewing data feeds, and exposing tables.
- Data Catalog: This component allows the user to discover and reuse queries using the Data Catalog. Metadata can be facilitated for search functionality.
What is DAX Function?
Data Analysis Expressions (DAX) is a formula expression language which can be used with various visualization tools like Power BI. It is also known as a functional language, where the full code is kept inside a function. DAX programming formulas contain two data types: Numeric and Other.
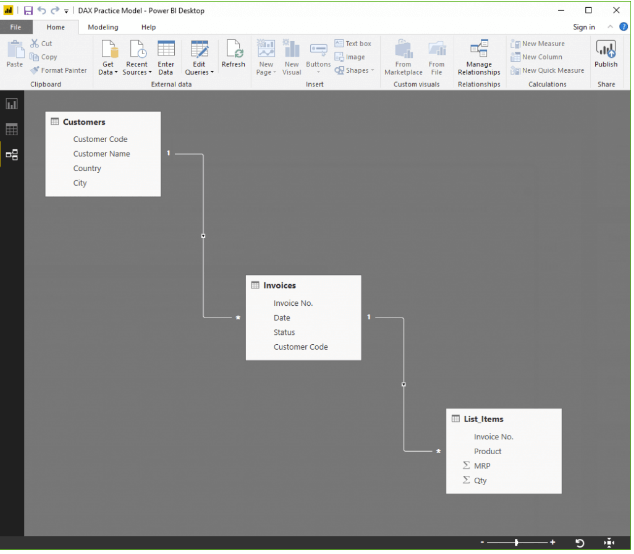
Tables are linked to each other by common columns. Here is a simple diagram of a Power BI data model showing the relationships:
There are 3 places in Power BI where you can use DAX:
- Calculated Columns
- Measures
- Tables
Let’s see all these Power BI examples and see how DAX functions work.
Calculated Columns
A calculated column allows you to create new columns based on the given data.
For example, there is no ‘Final price’ column available in the Items table. Here, the DAX function is used to calculate a new column when only unit price & quantity are available.
Price = List_Items[MRP]*List_Items[Qty]
In the data shown in the above Power BI example, each row will now have the respective calculated price.
Measures
You can perform a calculation using a measure without the need to add any data, as shown in the below Power BI example. This is very helpful for reports where the price can be displayed without requiring an entirely new column to store it.
Example:
1] Total of the MRP column * Total of Qty column
Tables
DAX functions in a tabular model can return entire tables. For example, to generate a list of all the cities the organization has clients in, use the function:
cities touched = DISTINCT(Customers[City])
A word on Filters
Filters hide rows that don’t fit given criteria. A calculation after filtering out data will be applicable only to rows which match those criteria.
Power BI DAX Functions
Some important DAX functions are:
Average
This DAX function allows you to find the average from a given set of values, as shown in the below Power BI example.
Example –
AvgComm = AVERAGE(List_Items[Price])
Max
Helps you to find the maximum from a given set of values.
Example – Find out the highest order.
HighSale = MAX(List_Items[Price])
Min
Helps you to find the minimum from a given set of values.
Example – Allows you to find out the lowest order.
LowestSale = MIN(List_Items[Price])
Count
Counts any numerical data.
Example – Count the number of tickets issued.
TicketVolume = COUNT(Invoices[Ticket])
Concatenate
This function helps you to join values in calculated columns. You can use CONCATENATEX if working in measures.
Example – Concatenating the item names and MRPs will give a unique code for all the price points at which each product is sold.
ProMrp = CONCATENATE(List_Items[Item],List_Items[MRP])
TotalYTD
This function allows you to calculate the sum from the start of the current year to the specified date. It performs the calculation based on a calendar year, not a financial year.
Example – Calculate sales totals for the price column.
CumiSales = TOTALYTD(SUM(List_Items[Price]),Invoices[Date])
All
Returns everything and ignores filters.
Example – Used with the CALCULATE function above.
Power BI vs. Tableau
Here are the major differences between Power BI vs. Tableau:
| Parameters | Power BI | Tableau |
|---|---|---|
| Year of establishment | 2013 | 2003 |
| Application | Complete dashboards for analysis | Allows ad hoc analysis |
| Used by | Technical or non-technical users | Mostly used by analysts |
| Support | Limited support on the free tier; faster support for paid plans | Full support |
| Scalability | Good | Excellent |
| Infrastructure | SaaS | Flexible |
Power BI and Microsoft Fabric
The biggest recent change to Power BI is its integration into Microsoft Fabric, announced in May 2023. Fabric is Microsoft’s unified analytics platform that combines data engineering, data warehousing, real-time analytics, data science, and business intelligence on a shared data foundation called OneLake.
For Power BI users, daily work changes very little: Desktop, the Service, DAX, and Power Query behave as before, so existing skills carry over fully. The main differences are naming and licensing. Datasets are now called semantic models, and Premium per-capacity (P) SKUs have been retired in favor of Fabric (F) capacities.
Fabric also pushes AI forward. With a supported capacity, Copilot can draft report pages, write DAX measures, and summarize insights from a plain-language prompt. In short, learning Power BI today automatically prepares you for Microsoft Fabric tomorrow.
Advantages of Power BI
Beyond the core benefits covered in “Why use Power BI?” above, the advantages of Power BI include:
- New features are added every month, which is great for Excel users.
- Extensive database connectivity capabilities, plus the Q&A and publish-to-web features.
- Integration with both Python and R for custom visualizations.
- Power Query provides many options for wrangling and cleaning data.
- After publishing to the Power BI Service, you can schedule refreshes without manual intervention.
- Power BI is backed by artificial intelligence and machine learning capabilities, including Copilot.
Disadvantages of Power BI
Here are the cons/drawbacks of using Power BI:
- Dashboards and reports are shared only within your organization unless guest-user (Azure AD B2B) access is configured.
- Power BI will not mix imported data with data accessed from real-time connections.
- With a Pro license, Power BI does not accept semantic models (datasets) larger than 1 GB; larger models require Premium Per User or Fabric capacity.
- Dashboards never accept or pass user, account, or other entity parameters.
- Relatively few data sources permit real-time connections to Power BI reports and dashboards.