
What is Business Intelligence (BI)? Definition & Meaning
 Editorial Team
⚡ Smart Summary
Business Intelligence converts raw operational data into meaningful information that supports fact-based decisions. It combines the processes, architectures, and technologies that let organizations measure performance, spot market trends, and act with confidence rather than assumption.

What is Business Intelligence?
Business Intelligence (BI) is a set of processes, architectures, and technologies that convert raw data into meaningful information which drives profitable business actions. It is a suite of software and services that transform data into actionable intelligence and knowledge.
BI has a direct impact on an organization’s strategic, tactical, and operational decisions. It supports fact-based decision making that relies on historical data rather than assumptions or gut feeling.
BI tools perform data analysis and produce reports, summaries, dashboards, maps, graphs, and charts, giving users detailed intelligence about the nature of the business.
Why is Business Intelligence Important?

Business Intelligence matters because it turns scattered data into a reliable basis for action. The main reasons it is important include the following:
- Measurement: creating Key Performance Indicators (KPIs) based on historical data.
- Identifying and setting benchmarks for a variety of processes.
- Helping organizations identify market trends and spot business problems that need to be addressed.
- Improving data visualization, which enhances data quality and, in turn, the quality of decision making.
- Serving not only large enterprises but also small and medium enterprises (SMEs).
How Business Intelligence Systems Are Implemented
A BI system moves data from raw source to finished insight through three broad stages:
Step 1) Raw data is extracted from corporate databases. This data is often spread across multiple, heterogeneous source systems.
Step 2) The data is cleaned and transformed, then loaded into the data warehouse. Tables are linked and data cubes are formed so information is ready for analysis.
Step 3) Using the BI system, users can run queries, request ad-hoc reports, or conduct any other analysis they need.
Because these stages depend on a well-organized repository, many teams first design a robust data warehouse architecture before rolling out BI across departments.
Examples of Business Intelligence Systems Used in Practice
Example 1:
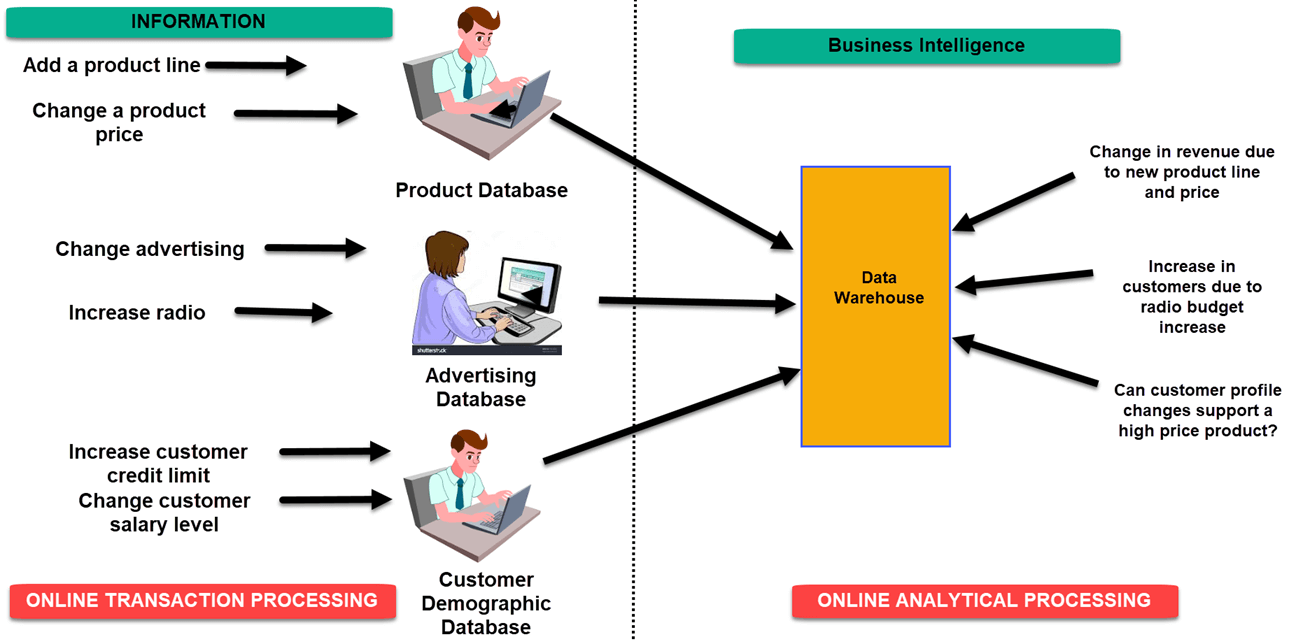
In an Online Transaction Processing (OLTP) system, the information fed into a product database could include:
- Adding a product line.
- Changing a product price.
In a Business Intelligence system, the matching query for the product subject area could ask whether adding a new product line or changing a product price increased revenue.
In the advertising database of an OLTP system, the data entered could include:
- Changing advertisement options.
- Increasing the radio budget.
In a BI system, the corresponding query could ask how many new clients were added because of the change in the radio budget.
In an OLTP system holding customer demographic data, the entries could include:
- Increasing a customer credit limit.
- Changing a customer salary level.
In the OLAP system, the matching query could ask whether customer profile changes support a higher product price.
Example 2:
A hotel owner uses BI analytical applications to gather statistics on average occupancy and room rates, which helps calculate the aggregate revenue generated per room.
The system also collects data on market share and customer surveys from each hotel to gauge its competitive position across different markets.
By analyzing these trends year by year, month by month, and day by day, management can decide when to offer discounts on room rentals.
Example 3:
A bank gives branch managers access to BI applications. This helps each manager identify the most profitable customers and decide which relationships to prioritize.
Using BI tools also frees IT staff from generating analytical reports for every department, and it gives department personnel direct access to a richer data source.
Four Types of BI Users
Business Intelligence serves four key groups of users, each with different needs:
1. The professional data analyst:
The data analyst is a statistician who needs to drill deep into data. BI helps them uncover fresh insights and develop unique business strategies.
2. The IT users:
IT users play a dominant role in building and maintaining the BI infrastructure that everyone else relies on.
3. The head of the company:
A CEO or CXO uses BI to raise profits by improving operational efficiency across the business.
4. The business users:
Business Intelligence users are found across the organization, and they fall into two groups:
- The casual business intelligence user.
- The power user.
The difference is that a power user can work with complex data sets, while a casual user relies on dashboards to evaluate predefined sets of data.
Advantages of Business Intelligence
Here are the main advantages of using a Business Intelligence system:
1. Boosts productivity:
With a BI program, businesses can create reports with a single click, saving time and resources and letting employees stay productive on their core tasks.
2. Improves visibility:
BI improves the visibility of business processes and makes it easier to identify any areas that need attention.
3. Fixes accountability:
BI assigns clear accountability, since someone must own the organization’s performance against its set goals.
4. Gives a bird’s eye view:
Decision makers gain an overall bird’s eye view through typical BI features such as dashboards and scorecards.
5. Streamlines business processes:
BI removes much of the complexity in business processes and automates analytics through predictive analysis, modeling, and benchmarking.
6. Simplifies analytics:
BI has democratized analytics, allowing even non-technical users to collect and process data quickly and putting analytical power in more hands.
Disadvantages of Business Intelligence
1. Cost:
Business Intelligence can be costly for small and medium enterprises, and it may be expensive to justify for routine business transactions.
2. Complexity:
BI can be complex to implement because of the underlying data warehouse, and that complexity can make business practices rigid.
3. Limited adoption:
Like most new technologies, BI was first priced for large, wealthy firms, so it remains less affordable for many small and mid-sized companies.
4. Time-consuming implementation:
A data warehousing system can take around eighteen months to implement fully, which makes BI a time-consuming investment.
Trends in Business Intelligence
Several business intelligence and analytics trends are worth watching:
Artificial Intelligence: AI and machine learning now handle complex analytical tasks once done by people. This capability is used to deliver real-time data analysis and dashboard reporting.
Collaborative BI: BI software combined with collaboration tools, including social media and other current technologies, helps teams work together and share findings for collaborative decision making.
Embedded BI: Embedded BI integrates BI software, or some of its features, directly into another business application to enhance and extend that application’s reporting.
Cloud Analytics: BI is increasingly delivered from the cloud, and more businesses are shifting to it. Spending on cloud-based analytics is expected to grow far faster than on-premise options.
