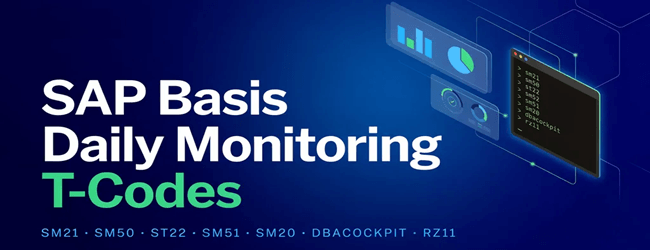
SAP Basis Monitoring Tcodes & Health Checks
⚡ Smart Summary
SAP System Monitoring is a daily Basis routine that keeps servers, work processes, locks, updates, and database health under control. Core T-codes such as SM51, SM50, SM66, SM21, ST22, ST02, ST06, DB02, and DB12 give administrators a complete proactive checklist.
What is SAP System Monitoring?
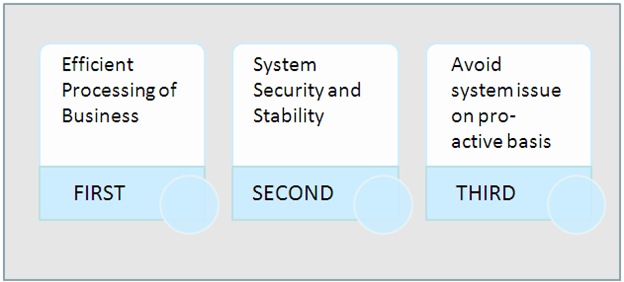
SAP System Monitoring is the daily Basis routine that keeps an SAP landscape healthy by checking servers, work processes, locks, updates, system logs, and database health at regular intervals. The goal is proactive — to spot problems before users notice them.
A typical daily checklist includes:
- Checking application servers.
- Monitoring system-wide work processes.
- Monitoring work processes for individual instances.
- Monitoring lock entries.
- CPU utilisation.
- Available space in the database.
- Monitoring update processes.
- Monitoring the system log.
- Buffer statistics.
- Monitoring batch jobs.
- Spool request monitoring and print-request counts.
- ABAP dump analysis.
- Database performance and consistency checks.
- Monitoring application users.
Why Daily Basis Checks and System Monitoring?
Daily checks catch small issues — a stuck work process, an old lock, a tablespace nearing 95% — before they cascade into outages. They give the Basis team a reliable baseline so anomalies stand out, and they feed historical data into capacity-planning decisions.
How Do We Monitor a SAP System?
Monitoring is organised around T-codes, each owning a specific layer — servers, work processes, locks, updates, logs, buffers, CPU, dumps, spool, batch jobs, RFC, and the database. The sections below walk through every check in order.
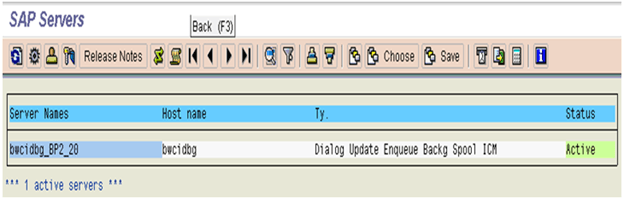
Checking Application Servers (SM51)
SM51 lists every active application server in the landscape, along with the services and work processes configured on each instance.
Monitoring Work Processes for Individual Instances (SM50)
SM50 displays every running, waiting, stopped, and PRIV process on the current instance. Every process should be in Running or Waiting status; anything else needs investigation.
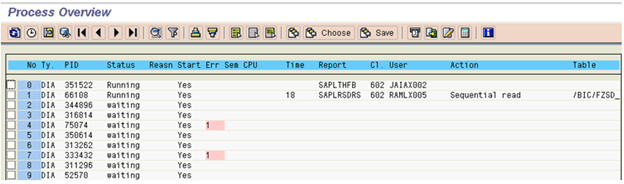
The screen surfaces several useful columns:
- The status of each work process (occupied or free).
- The action being taken by an occupied process, shown in the Action column.
- The database table being worked on.
Typical problems and remedies:
- Users can’t log on or the GUI is slow: dialog (DIA) work processes are exhausted. Look for long-running jobs (red indicator under Time). Cancel them via Process > Cancel without core to free the slot.
- PRIV under the Reason column: a transaction is consuming so much memory that the DIA work process is “owned” by one user. Speak to the user and, if possible, rerun the job in the background.
- Long-running SPO work process: investigate the print server or printer; a stuck spool can monopolise a process.
Monitoring System-wide Work Processes (SM66)
SM66 is the Global Work Process Overview. It rolls SM50 data across every active instance into one screen, which makes it the quickest way to spot a system-wide performance issue.
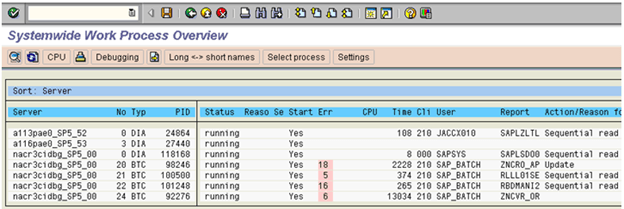
At a glance you see:
- The status of every application server.
- Why a process is not running.
- Whether the process has been restarted.
- CPU usage and request runtime.
- The logged-on user and client.
- The report currently executing.
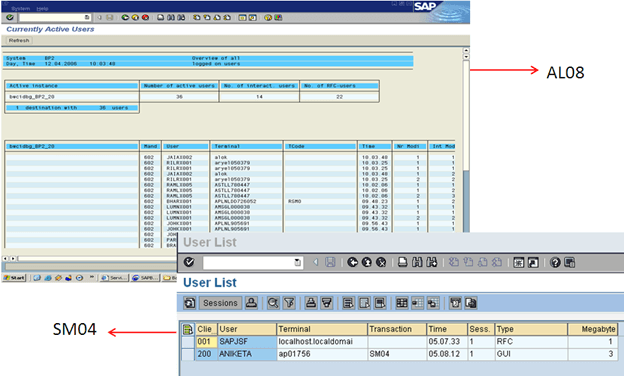
Monitor Application Users (AL08 and SM04)
AL08 lists users across every active instance, while SM04 shows users on the current instance. Both surface terminal IDs and clients, which help confirm that only expected user IDs are logged on.
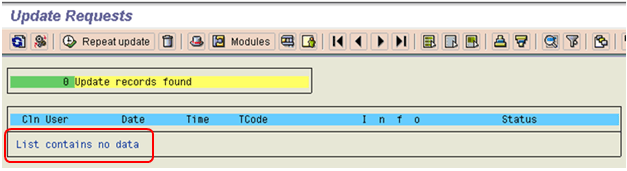
Monitoring Update Processes (SM13)
Run SM13, place * in the User field, and execute. If there are no pending updates the queue is empty.
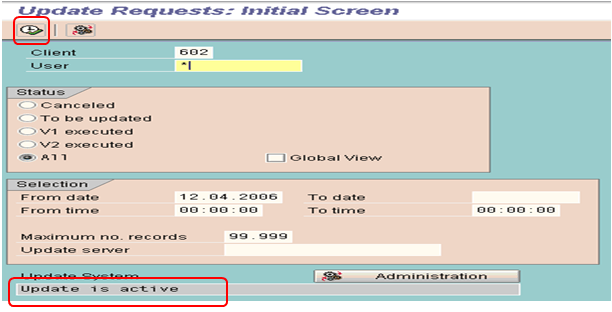
If updates are not active, answer the following questions:
- Is the update process active? If not, was it deactivated by the system or by a user?
- Has any update been cancelled?
- Is there a long queue of pending updates older than 10 minutes?
Monitoring Lock Entries (SM12)
Run SM12 and enter * in the User Name field.
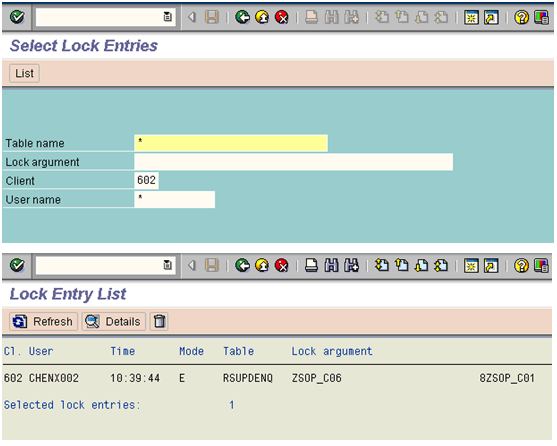
SAP uses a locking mechanism to prevent two users from changing the same record at the same time. Sometimes a network drop or session crash leaves a lock behind. Old locks must be cleared, or they block access to records.
Capture lock entries whose timestamp is from the previous day or earlier — those are the candidates for cleanup.
Monitoring the System Log (SM21)
SM21 surfaces system errors, warnings, and security messages. Use it to pinpoint and rectify issues in the system and its environment.
Check the previous day’s log with:
- Enter the date and time range.
- Select the Problems and Warnings radio button.
- Click Reread System Log.

Tune Summary (ST02)
ST02 shows the buffer tune summary. Use the steps below to act on swap problems.
Step 1) Open ST02 to view the tune summary.
Step 2) Double-click any red value under SWAPS.

Step 3) Click the Current Parameters tab.

Step 4) Note the values and the profile parameters.

Step 5) Open RZ10 to change profile-parameter values.
Step 6) Save the changes.
Step 7) Restart the server so the new values take effect.
CPU Utilization (ST06)
ST06 shows operating-system level performance. Idle CPU utilisation should sit around 60–65%; sustained higher load means the system is under pressure.

When CPU is high, follow this short triage path:
- Run OS-level commands (such as
top) to find which processes are using the most CPU. - Open SM50 or SM66 and look for long-running jobs or update queries.
- Open SM12 and check for old lock entries.
- Open SM13 to check update status.
- Open SM21 to look for system errors.
ABAP Dumps (ST22)
ST22 captures ABAP runtime errors (short dumps). Review the previous day’s dumps each morning to spot unusual patterns or repeat offenders.

Spool Request Monitoring (SP01)
Run SP01 to monitor spool requests:
- Enter
*in the Created By field. - Click Execute.

Record only requests terminated with problems.

Monitoring Batch Jobs (SM37)
Run SM37 to monitor background jobs:
- Enter
*in the User Name and Job name fields. - Under Job status select Scheduled, Cancelled, Released, and Finished.

Transactional RFC Administration (SM58)
Transactional RFC (tRFC), originally known as asynchronous RFC, executes the called function module on the RFC server exactly once.

Select the display period you want to review, enter * in the user field, and execute. The list shows any calls that have not run successfully or are still waiting in the queue.
QRFC Administration (Outbound Queue — SMQ1)
SMQ1 monitors outbound qRFC queues. Specify the client and look for queues in Waiting or Error state.

QRFC Administration (Inbound Queue — SMQ2)
SMQ2 mirrors SMQ1 for inbound qRFC queues. Specify the client and look for incoming queues in Waiting or Error state.

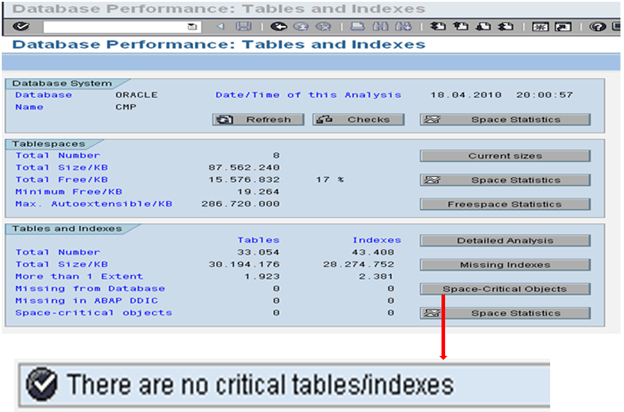
Database Administration (DB02)
DB02 is the central database administration cockpit. The first screen lets you drill into tablespaces, missing indexes, and growth history.
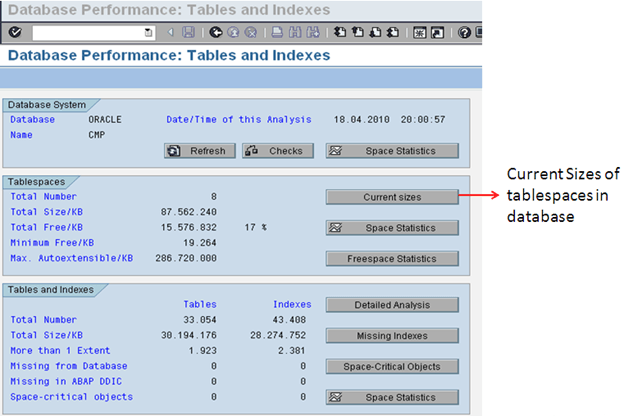
Select Current Sizes to see the status of every tablespace.

If any tablespace is more than 95% full and auto-extend is off, add a new datafile so the database does not run out of space.
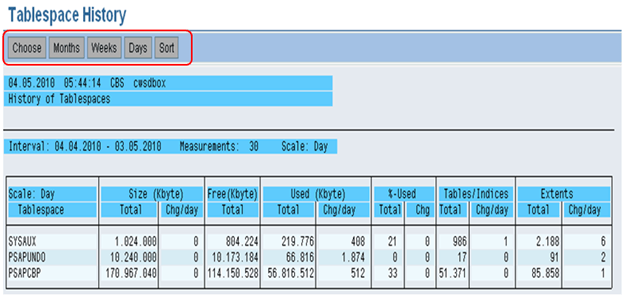
You can also review the history of a tablespace by month, week, or day to spot growth trends.

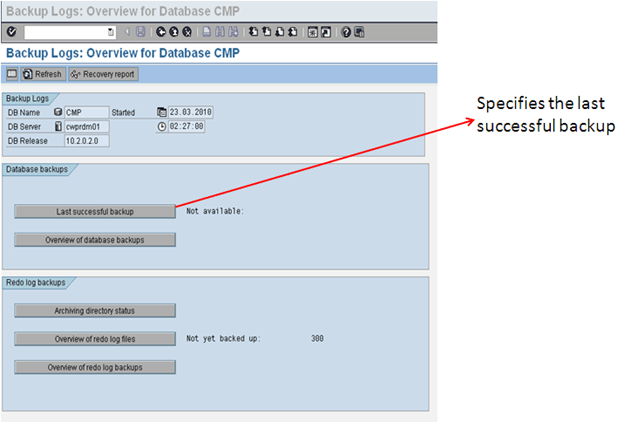
Database Backup Logs (DB12)
DB12 confirms when the last successful backup ran. Review the previous day’s database and redo-log backups to make sure they finished cleanly.
Quick Review: Daily Monitoring Checklist
The tables below summarise the critical daily checks for Basis administrators.
Critical Tasks
| # | Task | Transaction | Procedure / Remark |
|---|---|---|---|
| 1 | Confirm the R/3 system is up. | — | Log on to the R/3 system. |
| 2 | Confirm the daily backup ran without errors. | DB12 | Check the database backup log. |
SAP System Checks
| # | Task | Transaction | Procedure / Remark |
|---|---|---|---|
| 1 | Confirm every application server is up. | SM51 | All servers up. |
| 2 | Check work processes. | SM50 | All work processes in Running or Waiting status. |
| 3 | Global work-process overview. | SM66 | No work process running more than 1800 seconds. |
| 4 | Look for failed or terminated updates. | SM13 | Set date to one day ago, enter * in User ID, set to “All” updates. Look for lines with Err. |
| 5 | Check the system log. | SM21 | Set the date and time to before the last review. Look for errors, warnings, security messages, and database problems. |
| 6 | Review cancelled jobs. | SM37 | Enter * in User ID. Confirm every critical job finished successfully. |
| 7 | Check for old locks. | SM12 | Enter * in User ID. |
| 8 | Check for users on the system. | SM04 / AL08 | Look for unexpected user IDs or terminals; review several times per day. |
| 9 | Check for spool problems. | SP01 | Enter * in Created By. Look for spool jobs stuck “In process” for over an hour. |
| 10 | Check the job log. | SM37 | Look for new or incorrect jobs. |
| 11 | Review and resolve dumps. | ST22 | Look for excessive or unusual dumps. |
| 12 | Review buffer statistics. | ST02 | Look for swaps. |
Database Checks
| # | Task | Transaction | Procedure / Remark |
|---|---|---|---|
| 1 | Review the database error log. | ST04 | Investigate any new errors. |
| 2 | Database growth and missing indexes. | DB02 | If a tablespace is > 90% used add a new datafile; rebuild missing indexes. |
| 3 | Database statistics log. | DB13 | Confirm scheduled statistics jobs completed. |