
How to Replace Missing Values(NA) in R: na.omit & na.rm
 Editorial Team
⚡ Smart Summary
Replace Missing Values in R covers detecting NA values, removing incomplete rows with na.omit(), and imputing them with the mean or median through mutate(). This walkthrough uses the Titanic dataset, where age and fare both carry missing observations.

What Are Missing Values in R?
Missing values appear when an observation has no recorded value in a column, or when a non-numeric placeholder sits where a number should be. They must be removed or replaced before any calculation, because most R functions return NA the moment one is present.
This tutorial shows how to handle missing values with the dplyr library, part of the tidyverse ecosystem for data analysis.
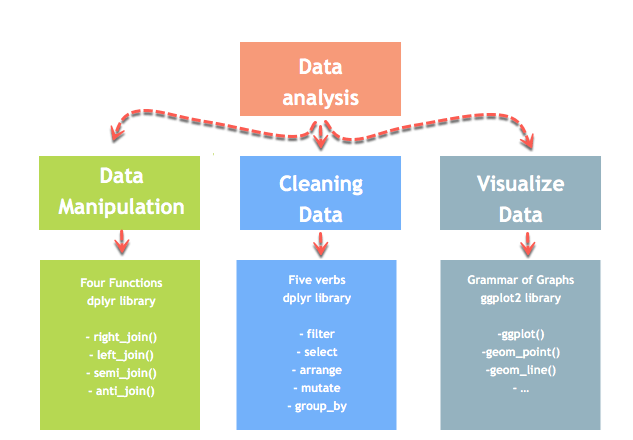
The first step is always to find out how many values are missing and where.
How to Detect and Count Missing Values in R
Before deciding what to do about missing values you need to know how many there are and where they sit. R offers four checks, from a single yes-or-no answer to a full per-column tally.
# 1. Is there any NA at all?
anyNA(df_titanic)

# 2. How many in total?
sum(is.na(df_titanic))

# 3. How many per column, the most useful view
colSums(is.na(df_titanic))

# 4. Percentage missing per column
round(colMeans(is.na(df_titanic)) * 100, 1)
colSums() is the one to reach for in practice. It returns a named vector with one count per column, which immediately shows whether a variable is missing a handful of values or is mostly empty.
Counting complete rows. complete.cases() returns TRUE for rows with no missing value anywhere, which tells you in advance how much data na.omit() would discard:
sum(complete.cases(df_titanic))       # rows that would survive
sum(!complete.cases(df_titanic))      # rows that would be dropped
A warning about placeholders. R only recognises NA. Datasets frequently encode missing values as an empty string, a space, “N/A”, “-“, or a sentinel number such as -99 or 999. Those pass every check above unnoticed. Convert them on import so the rest of the workflow behaves:
df <- read.csv(PATH, na.strings = c("", " ", "NA", "N/A", "-", "-99"))
Always scan the range of each numeric column after import. An age of -99 or a fare of 9999 is far more dangerous than an honest NA, because no function will warn you about it.
Types of Missing Data: MCAR, MAR and MNAR
Why a value is missing determines whether imputing it is safe. Statisticians recognise three mechanisms.
- MCAR, missing completely at random. The probability of being missing is unrelated to anything, observed or not, for example a sensor that fails at random moments. Dropping or imputing these rows introduces no bias, only a loss of precision.
- MAR, missing at random. The probability depends on other observed variables but not on the missing value itself. If older passengers were less likely to have their age recorded, age is MAR given the other columns. Imputation that uses those columns handles this well.
- MNAR, missing not at random. The probability depends on the unobserved value itself, for example high earners declining to state their income. No imputation method can fix this from the data alone, and the missingness itself carries information worth recording in a flag column.
Mean imputation, as used in this tutorial, is only defensible under MCAR and simple MAR. Even then it has a known cost: filling every gap with the same number shrinks the variance of the column and weakens its correlation with everything else. For serious work, use a model-based method such as the mice package, and always keep a flag column marking which values were imputed.
mutate()
mutate() is the dplyr verb that creates a new variable or overwrites an existing one, which makes it the natural tool for building a cleaned copy of a column.
We will proceed in two parts. We will learn how to:
- exclude missing values from a data frame
- impute missing values with the mean and median
The verb mutate() is very easy to use. We can create a new variable following this syntax:
mutate(df, name_variable_1 = condition, ...)
arguments:
-df: Data frame used to create a new variable
-name_variable_1: Name and the formula to create the new variable
-...: No limit constraint. Possibility to create more than one variable inside mutate()
Exclude missing values (NA)
na.omit() is a base R function, not a dplyr verb, but it pipes cleanly all the same. It drops every row containing at least one NA. That is the quickest option and rarely the best one, because a single missing value discards the whole observation.
To tackle the problem of missing observations, we will use the titanic dataset. In this dataset, we have access to the information of the passengers on board during the tragedy. This dataset has many NA that need to be taken care of.
Load the CSV file from the internet, then list the columns that contain NA:
PATH <- "https://raw.githubusercontent.com/guru99-edu/R-Programming/master/test.csv"
df_titanic <- read.csv(PATH, sep = ",")
# Return the column names containing missing observations
list_na <- colnames(df_titanic)[ apply(df_titanic, 2, anyNA) ]
list_na
Output:
## [1] "age" "fare"
Here,
colnames(df_titanic)[apply(df_titanic, 2, anyNA)]
returns the names of the columns that contain at least one missing value.
The columns age and fare have missing values.
We can drop them with the na.omit().
library(dplyr)
# Exclude the missing observations
df_titanic_drop <-df_titanic %>%
na.omit()
dim(df_titanic_drop)
Output:
## [1] 1045 13
The new dataset contains 1045 rows compared to 1309 with the original dataset.
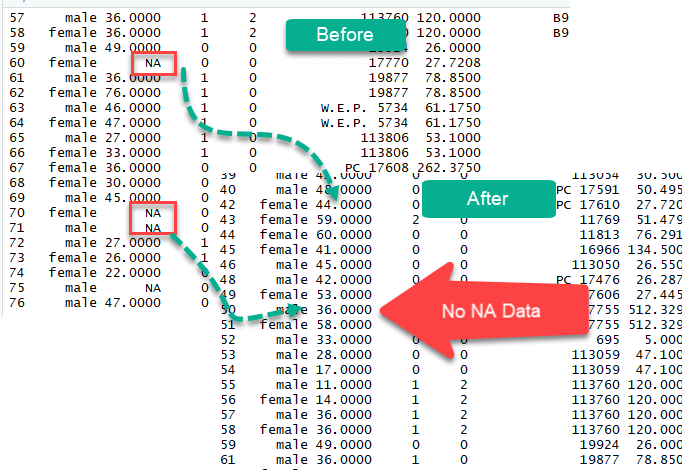
Impute missing data with the mean and median
You can also impute, that is populate, missing values with the mean or the median. A good practice is to create two separate variables for the mean and the median. Once created, we can replace the missing values with the newly formed variables.
We will use the apply method to compute the mean of the column with NA. Let’s see an example
Step 1) Earlier in the tutorial, we stored the columns name with the missing values in the list called list_na. We will use this list
Step 2) Compute the mean with the argument na.rm = TRUE. This argument is compulsory because the columns have missing data, and this tells R to ignore them.
# Create mean
average_missing <- apply(df_titanic[,colnames(df_titanic) %in% list_na],
      2,
      mean,
      na.rm =  TRUE)
average_missing
Code Explanation:
We pass 4 arguments in the apply method.
- df: df_titanic[,colnames(df_titanic) %in% list_na]. This code will return the columns name from the list_na object (i.e. “age” and “fare”)
- 2: Compute the function on the columns
- mean: Compute the mean
- na.rm = TRUE: Ignore the missing values
Output:
##      age     fare
## 29.88113 33.29548
We successfully created the mean of the columns containing missing observations. These two values will be used to replace the missing observations.
Step 3) Replace the NA Values
The verb mutate from the dplyr library is useful in creating a new variable. We don’t necessarily want to change the original column so we can create a new variable without the NA. mutate is easy to use, we just choose a variable name and define how to create this variable. Here is the complete code
# Create a new variable with the mean and median
df_titanic_replace <- df_titanic %>%
   mutate(replace_mean_age  = ifelse(is.na(age), average_missing[1], age),
   replace_mean_fare = ifelse(is.na(fare), average_missing[2], fare))
Code Explanation:
We create two variables, replace_mean_age and replace_mean_fare as follow:
- replace_mean_age = ifelse(is.na(age), average_missing[1], age)
- replace_mean_fare = ifelse(is.na(fare), average_missing[2],fare)
If the column age has missing values, then replace with the first element of average_missing (mean of age), else keep the original values. Same logic for fare
sum(is.na(df_titanic_replace$age))
Output:
## [1] 263
After the replacement, the new column contains no missing values at all:
sum(is.na(df_titanic_replace$replace_mean_age))
Output:
## [1] 0
The original age column holds 263 missing values, while the new replace_mean_age column has filled every one of them with the mean age.
Step 4) We can replace the missing observations with the median as well.
median_missing <- apply(df_titanic[,colnames(df_titanic) %in% list_na],
      2,
      median,
      na.rm =  TRUE)
df_titanic_replace <- df_titanic %>%
            mutate(replace_median_age  = ifelse(is.na(age), median_missing[1], age),
            replace_median_fare = ifelse(is.na(fare), median_missing[2], fare))
head(df_titanic_replace)
Output:

Step 5) On a wide dataset the step-by-step method becomes tedious. sapply() collapses the whole procedure into one statement, at the cost of never seeing the imputed values.
sapply does not create a data frame, so we can wrap the sapply() function within data.frame() to create a data frame object.
# Quick code to replace missing values with the mean
df_titanic_impute_mean <- data.frame(
    sapply(
        df_titanic,
        function(x) ifelse(is.na(x),
            mean(x, na.rm = TRUE),
            x)))
Modern Imputation with replace_na() and across()
The apply() and sapply() approaches above still work, but tidyr and dplyr now express the same operations more safely and more readably.
replace_na() for fixed values. tidyr::replace_na() takes a named list of columns and their replacements:
library(tidyr)

df_titanic %>%
    replace_na(list(age = 29.88, fare = 33.30))
across() for every numeric column. This is the direct, type-safe replacement for the sapply() one-liner, and unlike sapply() it never touches character or factor columns:
library(dplyr)

# Mean-impute every numeric column
df_titanic %>%
    mutate(across(where(is.numeric),
                  ~ ifelse(is.na(.x), mean(.x, na.rm = TRUE), .x)))

# Median-impute instead
df_titanic %>%
    mutate(across(where(is.numeric),
                  ~ ifelse(is.na(.x), median(.x, na.rm = TRUE), .x)))
⚠️ Why the sapply() shortcut is risky: the one-line sapply() example runs over every column, including character and factor ones. Calling mean() on those returns NA with a warning, and sapply() then coerces the whole result to character. The across(where(is.numeric), …) version above avoids this entirely.
coalesce() for fallback columns. When a second column can supply the missing value, coalesce() returns the first non-missing entry across its arguments:
df %>% mutate(age_final = coalesce(age, age_estimated, 0))
Keep a record of what you changed. Add a flag before imputing, so any later model can learn from the fact that a value was missing:
df_titanic %>%
    mutate(age_was_missing = is.na(age),
           age = ifelse(is.na(age), mean(age, na.rm = TRUE), age))
Handling Missing Values in R: Method Reference
Three approaches are covered in this tutorial:
- Exclude all of the missing observations
- Impute with the mean
- Impute with the median
The table below summarises detection and removal:
| Library | Objective | Code |
|---|---|---|
| base | List missing observations |
colnames(df)[apply(df, 2, anyNA)] |
| base | Remove every row containing NA |
na.omit(df) |
Imputation with mean or median can be done in two ways
- Using apply
- Using sapply
| Method | Details | Advantages | Disadvantages |
|---|---|---|---|
| Step by step with apply | Check columns with missing, compute mean/median, store the value, replace with mutate() | You can see the imputed mean or median | More execution time. Can be slow with big dataset |
| Quick way with sapply | Use sapply() and data.frame() to automatically search and replace missing values with mean/median | Short code and fast | The imputed values are never shown |
