
What is R Programming Language? Introduction & Basics of R
 Editorial Team
⚡ Smart Summary
R is a free, open-source programming language for statistical computing, data analysis and graphics, created by Ross Ihaka and Robert Gentleman and now maintained by the R Core Team with more than 20,000 CRAN packages.
What is R Software?
R is a programming language and free software developed by Ross Ihaka and Robert Gentleman at the University of Auckland in 1993. R possesses an extensive catalog of statistical and graphical methods. It includes machine learning algorithms, linear regression, time series and statistical inference, to name a few. Most of the R libraries are written in R, but for heavy computational tasks, C, C++ and Fortran code is preferred.
R is not only trusted by academics; many large companies also use the R programming language, including Uber, Google, Airbnb and Facebook. Development is now managed by the R Core Team, and the language is still under active release — R 4.6.1 arrived in June 2026.
Data analysis with R follows a series of steps: programming, transforming, discovering, modeling and communicating the results.
- Program: R is a clear and accessible programming tool
- Transform: R is made up of a collection of packages designed specifically for data science
- Discover: Investigate the data, refine your hypothesis and analyze it
- Model: R provides a wide array of tools to capture the right model for your data
- Communicate: Integrate code, graphs and outputs into a report with R Markdown, or build Shiny apps to share with the world
What is R used for?
Those five steps translate into three areas of work where R is the default choice:
- Statistical inference — hypothesis tests, confidence intervals and regression models
- Data analysis — importing, cleaning, reshaping and summarising tables
- Machine learning — classification, clustering and forecasting via caret, tidymodels and XGBoost
R by Industry
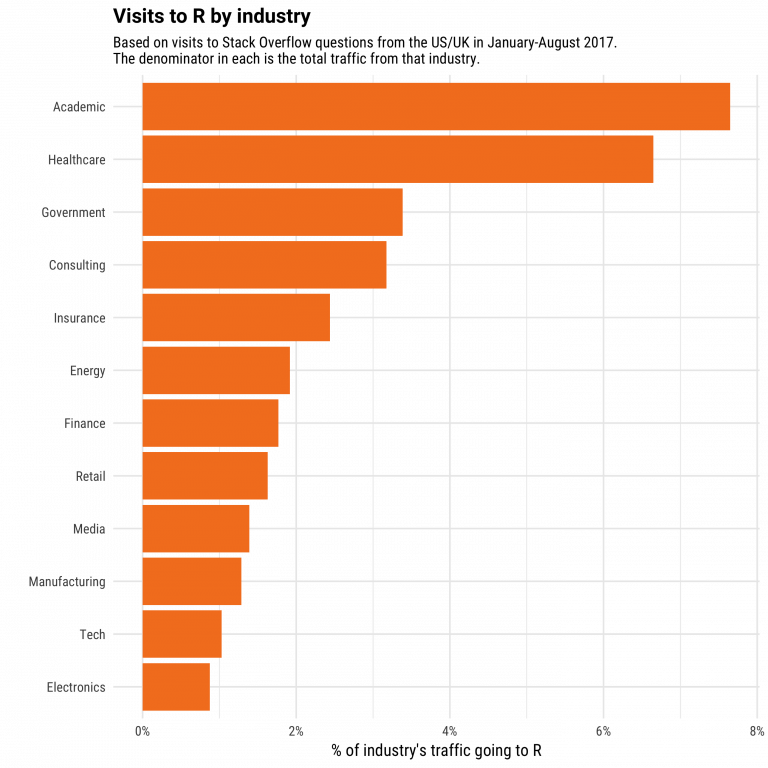
If we break down the use of R by industry, we see that academics come first. R is a language built for statistics, and it is the first choice in the healthcare industry, followed by government and consulting. The chart below shows how that usage is distributed.
R Packages and CRAN
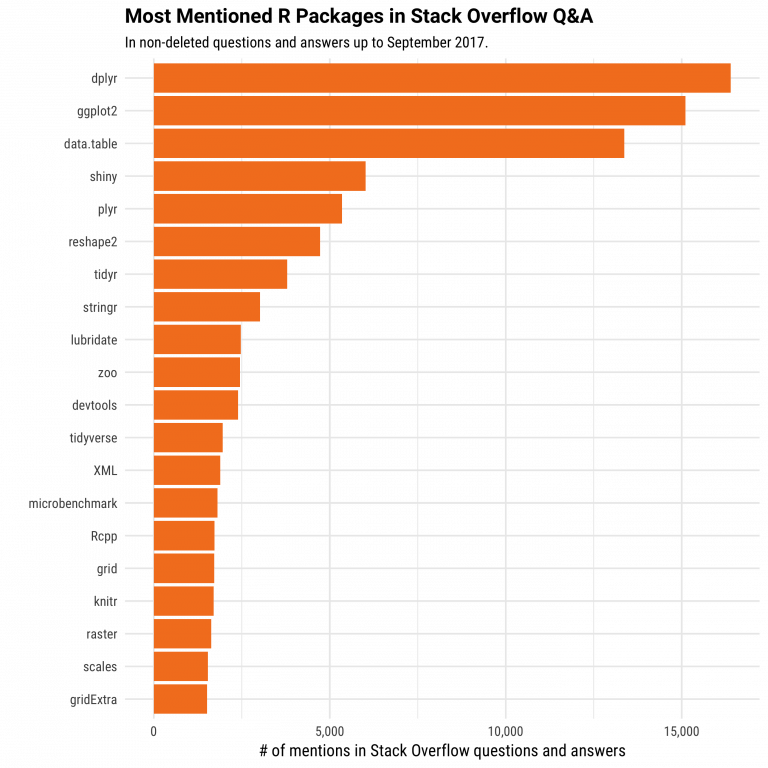
The primary uses of R are, and will always be, statistics, visualization and machine learning. The picture below shows which R packages attracted the most questions on Stack Overflow. In the top 10, most of them relate to the workflow of a data scientist: preparing data and communicating results.
Nearly all R packages are stored in CRAN, the Comprehensive R Archive Network, which is free and open source and today lists more than 20,000 contributed packages. You can download and use them to perform Machine Learning or time series analysis. The CRAN listing below is where every one of those packages is published and checked.

Installing one takes a single call, install.packages("dplyr") — the reason the dplyr and tidyverse family became the standard toolkit.
Communicate with R
Packages solve the analysis; the last step is sharing it. R has multiple ways to present and share work, either through a markdown document or a Shiny app. Everything can be hosted on RPubs, GitHub or the business’s own website.
Below is an example of a presentation hosted on RPubs.

RStudio accepts R Markdown — and, since 2022, Quarto — to write a document. As the export menu below shows, you can produce the documents in different formats:
- Document:
- HTML
- PDF/LaTeX
- Word
- Presentation:
- HTML
- PDF beamer

RStudio also has a great tool to create an app easily. Below is an example of an app built with World Bank data.

Why use R?
Knowing what R does is one thing; investing time in it is another. Data science is shaping the way companies run their businesses, and staying away from Artificial Intelligence and Machine Learning will lead a company to fail. The big question is which tool or language you should use.
Plenty of tools perform data analysis, and learning a new language requires a time investment. The picture below plots the learning curve against the business capability a language offers. The negative relationship implies there is no free lunch: the best insight from data costs time learning the appropriate tool.

On the top left of the graph you can see Excel and Power BI. These two tools are simple to learn but do not offer outstanding business capability, especially in terms of modeling. In the middle you can see Python and SAS. SAS is a dedicated tool for running statistical analysis in business, but it is not free; it is click-and-run software. Python has a gentle learning curve and is a fantastic tool for deploying Machine Learning and AI, but it has fewer reporting features. With a comparable learning curve, R is a good trade-off between implementation and data analysis.
You have probably heard about Tableau for data visualization. Tableau discovers patterns through graphs and charts and does not take long to learn, but a visualization-first tool can leave you with plenty of charts and no pattern. Tableau suits quick visualization or Business Intelligence; for statistics and decision-making, R is more appropriate.
Stack Overflow is a big community for programming languages, and it is there to help when you hit a coding issue or need to understand a model. Over the years, the percentage of question views increased sharply for R compared with other languages, as the trend line below shows. That tracks the booming age of data science, but it also reflects demand for R.

In data science, two tools compete with each other. R and Python are the programming languages that define the field.
Should you choose R?
A data scientist can use two excellent tools: R and Python. You may not have time to learn them both, especially when you are getting started. Learning statistical modeling and algorithms matters far more than learning a programming language. A programming language is a tool to compute and communicate your discovery. The most important task in data science is the way you deal with the data: import, clean, prepare, engineer features and select them. That should be your primary focus. Trying to learn R and Python at once without a solid background in statistics rarely works. Data scientists are not primarily programmers — their job is to understand the data, manipulate it and expose the best approach.
The principal audience for data science is the business professional, so communication matters: a report, a web app, a dashboard. You need one tool that does all of this, which is where R and its reporting stack hold their ground.
Is R difficult?
Years ago, R was a difficult language to master: confusing, and not as structured as other programming tools. To overcome that, Hadley Wickham developed a collection of packages called the tidyverse. The rules of the game changed for the better — data manipulation became intuitive and creating a graph was no longer difficult.
The best algorithms for machine learning can be implemented with R. Packages such as Keras and TensorFlow build high-end models, and R also has a package for XGBoost, one of the best algorithms for Kaggle competitions.
R can communicate with other languages: it is possible to call Python, Java and C++ from R. Big data is accessible too, since R connects to platforms such as Spark or Hadoop.
Finally, R has evolved to parallelize operations and speed up computation. R was once criticized for using only one CPU at a time; the parallel package now runs tasks on different cores of the machine.
