
ELK Stack Tutorial: Kibana, Logstash & Elasticsearch
 Editorial Team
⚡ Smart Summary
ELK Stack combines three open-source tools — Elasticsearch, Logstash, and Kibana — to collect, store, search, and visualize machine data, giving engineering teams centralized logging and real-time analytics for faster troubleshooting across servers and applications.
The ELK Stack is one of the most widely used open-source solutions for centralized logging and log analytics. This ELK Stack tutorial explains what Elasticsearch, Logstash, and Kibana are, how the three tools fit together, and where the platform is used in real-world monitoring and observability work.
What is the ELK Stack?
The ELK Stack is a collection of three open-source products — Elasticsearch, Logstash, and Kibana. It provides centralized logging that helps you identify problems with servers or applications by letting you search all your logs in a single place. It also helps you correlate logs across multiple servers within a specific time frame.
- E stands for Elasticsearch: used for storing logs.
- L stands for Logstash: used for shipping, processing, and storing logs.
- K stands for Kibana: a visualization tool (a web interface) that is hosted through Nginx or Apache.
Elasticsearch, Logstash, and Kibana are all developed, managed, and maintained by a company named Elastic.
Together, the ELK Stack is designed to let users take data from any source, in any format, and then search, analyze, and visualize that data in real time.
ELK Stack Architecture
Now that you know what the stack is, this section explains the ELK architecture and how data flows between the components.
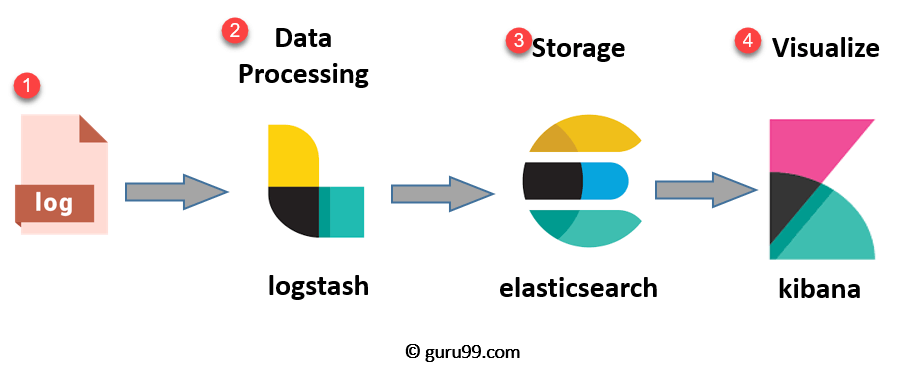
The ELK pipeline follows a clear sequence in which each tool has a dedicated job:
- Logs: The server logs that need to be analyzed are identified.
- Logstash: Collects the logs and event data, then parses and transforms it.
- Elasticsearch: The data transformed by Logstash is stored, searched, and indexed.
- Kibana: Uses the Elasticsearch database to explore, visualize, and share insights.
However, a fourth component named Beats is often added for data collection. Beats are lightweight shippers installed on servers, and adding them led Elastic to rename ELK as the Elastic Stack.
When you deal with very large amounts of data, you may add Kafka or RabbitMQ in front of the pipeline for buffering and resilience.
For added security, a reverse proxy such as Nginx can be placed in front of the stack.

With the architecture in mind, the following sections take a closer look at each open-source product in the stack.
What is Elasticsearch?
Elasticsearch is a NoSQL database based on the Lucene search engine and built with RESTful APIs. It offers simple deployment, high reliability, and easy management, and it stores all your data centrally so you can run advanced queries and quick document searches.
Elasticsearch also lets you store, search, and analyze large volumes of data. It is most often used as the underlying engine that powers applications with demanding search requirements.
Because it adds analytics and many advanced features on top of fast search, Elasticsearch has been widely adopted in search platforms for modern web and mobile applications.
Features of Elasticsearch
Elasticsearch offers a rich set of capabilities for indexing and searching data:
- An open-source search server written in Java.
- Able to index any kind of heterogeneous data.
- Provides a REST API web interface with JSON output.
- Full-text search.
- Near real-time (NRT) search.
- A sharded, replicated, searchable JSON document store.
- Schema-free, REST and JSON based distributed document store.
- Multi-language and geolocation support.
Advantages of Elasticsearch
- Stores schema-less data and can also create a schema for your data.
- Lets you manipulate records one by one using multi-document APIs.
- Supports filtering and querying your data for insights.
- Based on Apache Lucene and provides a RESTful API.
- Delivers horizontal scalability, reliability, and multi-tenant capability for real-time indexing and faster search.
- Helps you scale both vertically and horizontally.
The table below explains the key terms you will encounter when working with Elasticsearch:
| Term | Usage |
|---|---|
| Cluster | A cluster is a collection of nodes that together hold your data and provide combined indexing and search capabilities. |
| Node | A node is a single Elasticsearch instance. It is created when an Elasticsearch instance starts. |
| Index | An index is a collection of documents that share similar characteristics, such as customer data or a product catalog. It is useful for indexing, search, update, and delete operations, and you can define many indexes in one cluster. |
| Document | A document is the basic unit of information that can be indexed. It is expressed as a JSON key-value pair, and every document is associated with a type and a unique id. |
| Shard | Every index can be split into several shards to distribute data. A shard is the atomic part of an index and can be spread across the cluster as you add more nodes. |
What is Logstash?
Logstash is the data collection pipeline tool of the stack. It collects data inputs and feeds them into Elasticsearch, gathering all types of data from different sources and making it available for further use.
Logstash can unify data from disparate sources and normalize it into the destinations you choose. This lets you cleanse and democratize all your data for a wide range of analytics and visualization use cases.
It consists of three components:
- Input: passes logs in and converts them into a machine-readable format.
- Filters: a set of conditions that perform a particular action on an event.
- Output: the decision maker that routes each processed event or log.
Features of Logstash
Logstash includes several features that make log processing flexible:
- Events pass through each phase using internal queues.
- Allows different inputs for your logs.
- Supports filtering and parsing of your logs.
Advantages of Logstash
- Centralizes your data processing.
- Analyzes a wide variety of structured and unstructured data and events.
- Offers plugins to connect with many types of input sources and platforms.
What is Kibana?
Kibana is the data visualization tool that completes the ELK Stack. It is used to visualize Elasticsearch documents and helps developers gain quick insight into their data through interactive diagrams, geospatial data, and graphs that make complex queries easy to understand.
You can use Kibana to search, view, and interact with data stored in Elasticsearch indices. It also helps you perform advanced data analysis and present your data in a variety of tables, charts, and maps.
Kibana supports several methods for searching your data. The most common search types are listed below:
| Search Type | Usage |
|---|---|
| Free text searches | Used for searching a specific string. |
| Field-level searches | Used for searching a string within a specific field. |
| Logical statements | Used to combine searches into a logical statement. |
| Proximity searches | Used for searching terms within a specific character proximity. |
Kibana also offers a number of powerful features for exploring indexed data:
- A powerful front-end dashboard that visualizes indexed information from the Elasticsearch cluster.
- Enables real-time search of indexed information.
- Lets you search, view, and interact with data stored in Elasticsearch.
- Executes queries on data and visualizes results in charts, tables, and maps.
- A configurable dashboard to slice and dice Logstash logs in Elasticsearch.
- Provides historical data in the form of graphs, charts, and more.
- Offers real-time dashboards that are easy to configure.
Advantages and Disadvantages of Kibana
Like any tool, Kibana has clear strengths that explain its popularity:
- Easy visualization of data.
- Fully integrated with Elasticsearch.
- Acts as a dedicated visualization tool.
- Offers real-time analysis, charting, summarization, and debugging.
- Provides an intuitive, user-friendly interface.
- Allows sharing of snapshots of the logs you have searched.
- Permits saving and managing multiple dashboards.
It also has a few limitations to keep in mind:
- It works only with Elasticsearch as its data source.
- Building and tuning complex dashboards can involve a steep learning curve.
Why Log Analysis?
In cloud-based infrastructures, performance and isolation are very important.
The performance of virtual machines in the cloud can vary based on specific loads, environments, and the number of active users, so reliability and node failure can become significant issues.
A log management platform can monitor all of these issues. It can also process operating system logs, Nginx and IIS web-server logs for traffic analysis, application logs, and logs generated on AWS (Amazon Web Services).
Ultimately, log management helps DevOps engineers and system administrators make better, data-driven decisions. This is why log analysis through the Elastic Stack or similar tools has become essential.
ELK vs. Splunk
A common question is how the ELK Stack compares with Splunk, a popular commercial alternative. The table below summarizes the main differences:
| ELK | Splunk |
|---|---|
| ELK is an open-source tool. | Splunk is a commercial tool. |
| ELK does not offer Solaris portability because of Kibana. | Splunk offers Solaris portability. |
| Processing speed is strictly limited. | Offers accurate and speedy processing. |
| ELK is a technology stack created from the combination of Elasticsearch, Logstash, and Kibana. | Splunk is a proprietary tool that provides both on-premise and cloud solutions. |
| In ELK, searching, analysis, and visualization are only possible after the stack is set up. | Splunk is a complete data management package out of the box. |
| ELK offers limited built-in integration with other tools. | Splunk is useful for setting up integrations with other tools. |
Case Studies
Many well-known companies rely on the ELK Stack to run logging and analytics at scale. The examples below show how it is used in production.
Netflix
Netflix relies heavily on the ELK Stack to monitor and analyze the security logs of its customer-service operations. The platform lets Netflix index, store, and search documents across more than fifteen clusters made up of roughly 800 nodes.
The professional networking site LinkedIn uses the ELK Stack to monitor performance and security. Its team integrated ELK with Kafka to handle load in real time, and the operation spans more than 100 clusters across six data centers.
Tripwire
Tripwire, a worldwide Security Information and Event Management (SIEM) provider, uses the ELK Stack to support information-packet log analysis.
Medium
Medium, the popular blog-publishing platform, uses the ELK Stack to debug production issues and to detect DynamoDB hotspots. The stack helps the company support 25 million unique readers and thousands of new posts each week.
Advantages and Disadvantages of ELK Stack
Advantages
The ELK Stack offers several benefits that explain its wide adoption:
- It works best when logs from the various applications of an enterprise converge into a single ELK instance.
- It provides rich insight from that single instance and removes the need to log into hundreds of separate data sources.
- Rapid on-premise installation.
- Easy to deploy and scales both vertically and horizontally.
- Elastic offers many language clients, including Ruby, Python, PHP, Perl, .NET, Java, and JavaScript.
- Libraries are available for many programming and scripting languages.
Disadvantages
Despite its strengths, the ELK Stack has a few drawbacks to consider:
- The different components can become difficult to manage as you move to a more complex setup.
- There is a real learning curve, so expect some trial and error as you gain experience.
