
What is Dimensional Modeling in Data Warehouse? Learn Types
 Editorial Team
⚡ Smart Summary
Dimensional Model in Data Warehouse design organizes information into fact and dimension tables so analysts can retrieve and summarize numeric measures quickly, following the five-step Kimball method that identifies the business process, grain, dimensions, facts, and final schema.
What is Dimensional Modeling?
Dimensional Modeling (DM) is a data structure technique optimized for data storage in a data warehouse. Its purpose is to tune the database for the faster retrieval of data. The concept was developed by Ralph Kimball and is built around two table types: “fact” and “dimension” tables.
A dimensional model in a data warehouse is designed to read, summarize, and analyze numeric information such as values, balances, counts, and weights. Relational models, by contrast, are optimized for adding, updating, and deleting data in a real-time online transaction processing system.
Each of these approaches stores data in its own way, and each offers distinct advantages.
In a relational model, normalization and ER models reduce data redundancy. A dimensional model instead arranges data so that information is easier to retrieve and reports are easier to generate.
For this reason, dimensional models suit data warehousing systems rather than transaction-heavy relational systems. Because the model underpins the broader data warehouse architecture, the sections below break down its elements, types, and design steps.
Elements of Dimensional Data Model
Fact
Facts are the measurements or metrics drawn from a business process. In a sales process, for example, the quarterly sales number is a fact — the numeric value the business wants to analyze.
Dimension
A dimension provides the context that surrounds a business process event. In simple terms, dimensions supply the who, what, and where of a fact. For the “quarterly sales number” fact, the dimensions would be:
- Who – Customer names
- Where – Location
- What – Product name
In other words, a dimension is a window through which you view the information held in the facts.
Attributes
Attributes are the various characteristics of a dimension within a dimensional data model.
In a Location dimension, the attributes can be:
- State
- Country
- Zip code
Attributes are used to search, filter, and classify facts, and dimension tables are where those attributes live.
Fact Table
A fact table is the primary table in a dimensional model.
A fact table contains:
- Measurements or facts
- Foreign keys to dimension tables
Dimension Table
A dimension table holds the dimensions of a fact and joins to the fact table through a foreign key. Its main characteristics are listed below:
- Dimension tables are de-normalized tables.
- The dimension attributes form the columns of the table.
- Dimensions offer descriptive characteristics of the facts through their attributes.
- There is no fixed limit on the number of dimensions.
- A dimension can contain one or more hierarchical relationships.
Types of Dimensions in Data Warehouse
Dimensional modeling uses several kinds of dimensions, each suited to a particular design need. The main types of dimensions in a data warehouse are:
- Conformed Dimension
- Outrigger Dimension
- Shrunken Dimension
- Role-playing Dimension
- Dimension to Dimension Table
- Junk Dimension
- Degenerate Dimension
- Swappable Dimension
- Step Dimension
Steps of Dimensional Modelling
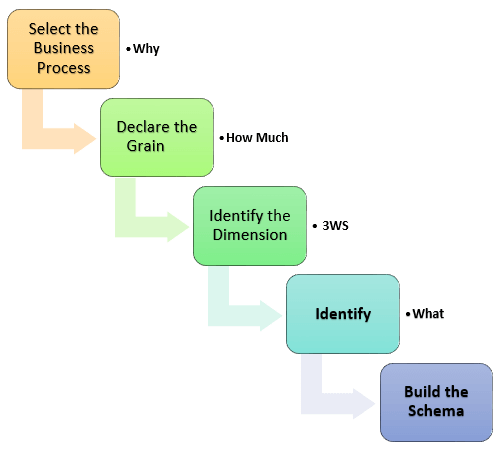
The accuracy of your dimensional modeling determines the success of the data warehouse implementation. There are five steps to build a dimensional model:
- Identify the business process
- Identify the grain (level of detail)
- Identify the dimensions
- Identify the facts
- Build the schema
Overall, the finished model should describe the why, how much, when, where, who, and what of your business process.
Step 1) Identify the Business Process
The first task is to identify the business process the warehouse should cover — marketing, sales, HR, and so on — based on the organization’s data analysis needs and the quality of data available. This is the most important step, because a mistake here produces cascading, hard-to-fix defects.
To describe the business process, you can use plain text, Business Process Modelling Notation (BPMN), or Unified Modelling Language (UML).
Step 2) Identify the Grain
The grain defines the level of detail for the business problem — the lowest level of information stored in any table.
If a table holds sales for every day, it has daily granularity; if it holds monthly totals, it has monthly granularity.
During this stage, you answer questions such as:
- Should the warehouse store all available products or only a few product types? This depends on the business processes selected.
- Should product sales be stored on a monthly, weekly, daily, or hourly basis? This depends on the reports executives request.
- How do these two choices affect the database size?
Example of grain: imagine the CEO of a multinational company wants to see the sales of specific products across different locations, measured each day.
In that scenario, the grain becomes “product sale information by location by the day.”
Step 3) Identify the Dimensions
Dimensions are nouns such as date, store, and inventory, and they hold the descriptive data.
For example, a date dimension may contain a year, a month, and a weekday.
Example of dimensions: the same daily-sales requirement drives the choice of dimensions.
For this scenario, the dimensions are Product, Location, and Time.
The Product dimension carries attributes such as the product key (a foreign key), name, type, and specifications.
The Location dimension is organized as a hierarchy: country, state, city, street address, and name.
Step 4) Identify the Facts
This step is closely tied to the system’s business users, because it defines the figures they consume from the data warehouse.
Most fact table rows are numeric values such as price or cost per unit.
Example of facts: the daily-sales requirement again sets the context.
Here, the fact is the sum of sales by product, by location, and by time.
Step 5) Build Schema
In this final step, you implement the dimensional model. A schema is simply the database structure — the arrangement of tables — and two schemas are especially common.
The first is the star schema, which is easy to design and named for its shape: a central fact table with dimension tables radiating outward like the points of a star.
In a star schema, the fact table is in third normal form while the dimension tables are de-normalized; this star schema in data warehouse modeling guide works through a complete example.
The second is the snowflake schema, an extension of the star schema in which each dimension is normalized and linked to further dimension tables, as explained in this snowflake schema in data warehouse model guide.
Rules for Dimensional Modelling
The following rules and principles guide effective dimensional modeling:
- Load atomic data into the dimensional structures.
- Build dimensional models around business processes.
- Make sure every fact table has an associated date dimension table.
- Keep all facts in a single fact table at the same grain or level of detail.
- Store report labels and filter domain values in the dimension tables.
- Give every dimension table a surrogate key.
- Continuously balance requirements with realities to deliver a solution that supports business decision-making.
Benefits of Dimensional Modeling
Dimensional modeling offers a number of practical benefits:
- Standardized dimensions allow easy, consistent reporting across areas of the business.
- Dimension tables store the history of the dimensional information.
- New dimensions can be introduced without major disruption to the fact table.
- Data is stored so that it is easier to retrieve once it is in the database.
- Compared with the normalized model, dimensional tables are easier to understand because information is grouped into clear business categories.
- The model is based on business terms, so the business knows what each fact, dimension, or attribute means.
- Because the model is de-normalized, it is optimized for fast querying, and many relational platforms optimize their execution plans for it.
- The schema delivers high performance with fewer joins and minimized data redundancy.
- Dimensional models accommodate change easily, since columns can be added to dimension tables without affecting existing business intelligence applications.
What is Multi-Dimensional Data Model in Data Warehouse?
A multidimensional data model represents data as data cubes, letting you model and view data across several dimensions defined by dimensions and facts. Such a model is usually organized around a central theme and represented by a fact table, and it forms the basis of OLAP analysis.
