Asp.Net Page Level Tracing, Debugging, Error Handling
⚡ Smart Summary
ASP.NET debugging, tracing, and error handling in Visual Studio help developers catch problems early, follow requests through trace.axd, and redirect users to custom error pages when unhandled exceptions occur during the development and production lifecycle.

In any application, errors are bound to occur during the development process. It is important to be able to discover errors at an early stage.
In Visual Studio, it is possible to do this for ASP.NET applications. Visual Studio is used for debugging and has error handling techniques for ASP.NET.
What is Debugging in ASP.NET?
Debugging is the process of adding breakpoints to an application. These breakpoints are used to pause the execution of a running program. This allows the developer to understand what is happening in a program at a particular point in time.
Let us take an example of a program. The program displays a string “We are debugging” to the user. Suppose when we run the application, for some reason, the string is not displayed. To identify the problem we need to add a breakpoint. We can add a breakpoint to the code line which displays the string. This breakpoint will pause the execution of the program. At this point, the programmer can see what is possibly going wrong. The programmer rectifies the program accordingly.
Here in the example, we will use our DemoApplication that was created in earlier chapters. In the following example, we will see:
- How to make the demo application display a string.
- How to add breakpoints to an application.
- How to debug the application using this breakpoint.
How To Debug an Application in ASP.NET
Below are the steps to make a demo application, add breakpoints and debug in ASP.NET:
Step 1) Open the application in Visual Studio.
Let us first ensure we have our web application open in Visual Studio. Ensure the DemoApplication is open in Visual Studio.

Step 2) Now open the Demo.aspx.cs file and add the below code line.
- We are just adding the code line Response.Write to display a string.
- So when the application executes, it should display the string “We are debugging” in the web browser.

namespace DemoApplication
{
    public partial class Demo : System.Web.UI.Page
    {
        protected void Page_Load(object sender, EventArgs e)
        {
            Response.Write("We are debugging");
        }
    }
}
Step 3) Add a breakpoint to the application.
A breakpoint is a point in Visual Studio where you want the execution of the program to stop.

- To add a breakpoint, you need to click the column where you want the breakpoint to be inserted. So in our case, we want our program to stop at the code line “Response.Write”. You do not need to add any command to add a breakpoint. You just need to click on the line on which you want to add a breakpoint.
- Once this is done, you will notice that the code gets marked in red. Also, a red bubble comes up in the column next to the code line.
Note: You can add multiple breakpoints in an application.
Step 4) Run the application in Debugging mode.
Now you need to run your application using Debugging Mode. In Visual Studio, choose the menu option Debug->Start Debugging.

Output:-

When you perform all the steps correctly, the execution of the program will break. Visual Studio will go to the breakpoint and mark the line of code in yellow.
Now, if the programmer feels that the code is incorrect, the execution can be stopped. The code can then be modified accordingly. To continue proceeding the program, the programmer needs to click the F5 button on the keyboard.
What is Tracing in ASP.NET?
Application tracing allows one to see if any pages requested result in an error. When tracing is enabled, an extra page called trace.axd is added to the application (see image below). This page is attached to the application and will show all the requests and their status.

How to Enable Tracing for an Application in ASP.NET
Let us look at how to enable tracing for an ASP.NET application:
Step 1) Let us work on our DemoApplication. Open the web.config file from the Solution Explorer.

Step 2) Add the below line of code to the web.config file. The trace statement is used to enable tracing for the application.
- The requestLimit in the trace statement specifies the number of page requests that have to be traced.
- In our example, we are giving a limit of 40. We give a limit because a higher value will degrade the performance of the application.

<?xml version="1.0" encoding="utf-8"?>
<!--
For more information on how to configure your ASP.NET application, please visit http://go.microsoft.com/fwlink/?LinkId=169433
-->
<configuration>
    <system.web>
        <compilation debug="true" targetFramework="4.0" />
        <httpRuntime targetFramework="4.0" />

        <trace enabled="true" pageOutput="false" requestLimit="40" localOnly="false" />

    </system.web>
</configuration>
Run the DemoApplication in Visual Studio.
Output:-

If you now browse to the URL http://localhost:53003/trace.axd, you will see the information for each request. Here you can see if any errors occur in an application. The following types of information are shown on the page:
- The time of the request for the web page.
- The name of the web page being requested.
- The status code of the web request (a status code of 200 means that the request is successful).
- The View Details link which allows you to view more details about the web request. One important detail provided is the header information, which shows what information is sent in the header of each web request.

Page Level Tracing in ASP.NET
Page Level Tracing in ASP.NET shows all the general information about a web page when it is being processed. This is useful in debugging if a page does not work for any reason. Visual Studio provides detailed information about various aspects of the page, such as the time for each method that is called in the web request.
For example, if your web application is having a performance issue, this information can help in debugging the problem. This information is displayed when the application runs in Visual Studio.
How to Enable Tracing at Page Level in ASP.NET
Let us look at how to enable page level tracing for an ASP.NET application:
Step 1) Let us work on our DemoApplication. Open the demo.aspx file from the Solution Explorer.

Step 2) Add the below line of code to enable page tracing. In the Page declaration, just append the attribute Trace=”true”. This code line will allow page level tracing.

<%@ Page Language="C#" AutoEventWireup="true" CodeBehind="Demo.aspx.cs" Inherits="DemoApplication.Demo" Trace="true" %>

<!DOCTYPE html>
<html xmlns="http://www.w3.org/1999/xhtml">
<head runat="server">
    <title></title>
</head>
<body>
    <form id="form1" runat="server">
    </form>
</body>
</html>
Run the application in Visual Studio.
Output:-

Now when the web page Demo.aspx is displayed, you will get a whole lot of information about the page. Information such as the time for each aspect of the page lifecycle is displayed on this page.
Error Handling: Displaying a Custom Error Page
In ASP.NET, you can have custom error pages displayed to the users. If an application contains any sort of error, a custom page will display this error to the user.
In our example, we are first going to add an HTML page. This page will display a string to the user “We are looking into the problem”. We will then add some error code to our demo.aspx page so that the error page is shown. Let us follow the below-mentioned steps.
Step 1) Let us work on our DemoApplication. Let us add an HTML page to the application.
- Right-click on the DemoApplication in Solution Explorer.
- Choose the menu option Add->HTML Page.

Step 2) In the next step, we need to provide a name to the new HTML page.
- Provide the name as ErrorPage.
- Click the OK button to proceed.

Step 3) The ErrorPage will automatically open in Visual Studio. If you go to the Solution Explorer, you will see the file added.

Add the code line “We are looking into the problem” to the HTML page. You do not need to close the HTML file before making the change to the web.config file.
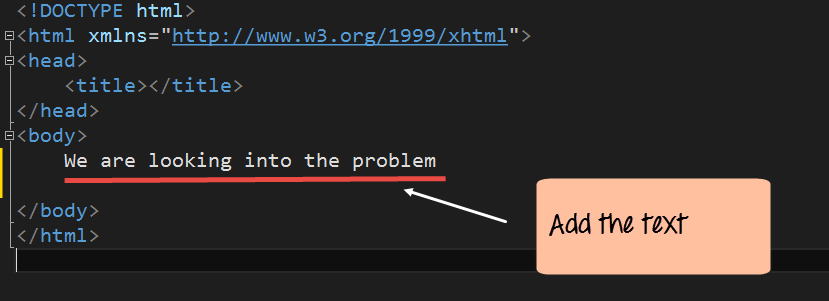
<!DOCTYPE html>
<html xmlns="http://www.w3.org/1999/xhtml">
<head runat="server">
    <title></title>
</head>
<body>
    We are looking into the problem
</body>
</html>
Step 4) Now you need to make a change in the web.config file. This change will notify that whenever an error occurs in the application, the custom error page needs to be displayed. The customErrors tag allows defining a custom error page. The defaultRedirect property is set to the name of our custom error page created in the previous step.

<configuration>
    <system.web>
        <compilation debug="true" targetFramework="4.0" />
        <httpRuntime targetFramework="4.0" />

        <customErrors mode="On" defaultRedirect="ErrorPage.html">
        </customErrors>

    </system.web>
</configuration>
Step 5) Now let us add some faulty code to the demo.aspx.cs page. Open this page by double-clicking the file in Solution Explorer.

Add the below code to the Demo.aspx.cs file.
- These lines of code are designed to read the lines of text from a file.
- The file is supposed to be located in the D drive with the name Example.txt.
- But in our situation, this file does not really exist. So this code will result in an error when the application runs.

namespace DemoApplication
{
    public partial class Demo : System.Web.UI.Page
    {
        protected void Page_Load(object sender, EventArgs e)
        {
            String path = @"D:\Example.txt";
            string[] lines;
            lines = File.ReadAllLines(path);
        }
    }
}
Now execute the code in Visual Studio and you should get the below output.
Output:-

The above page shows that an error was triggered in the application. As a result, the ErrorPage.html page is displayed to the user.
ASP.NET Unhandled Exception
Even in the best of scenarios, there can be cases of errors which are just not foreseen. Suppose a user browses to the wrong page in the application. This is something that cannot be predicted. In such cases, ASP.NET can redirect the user to the ErrorPage.html.
Let us see an example of this.
- We are going to use our same DemoApplication which has the ErrorPage.html.
- And we will try to view a web page which does not exist in our application.
- We should be redirected to our ErrorPage.html page in this case. Let us see the steps to achieve this.
Step 1) Let us work on our DemoApplication. Open the Global.asax.cs file from the Solution Explorer.

Note: The Global.asax.cs file is used to add code that will be applicable throughout all pages in the application.
Step 2) Add the below line of code to the Global.asax.cs. These lines will be used to check for errors and display the ErrorPage.html page accordingly.
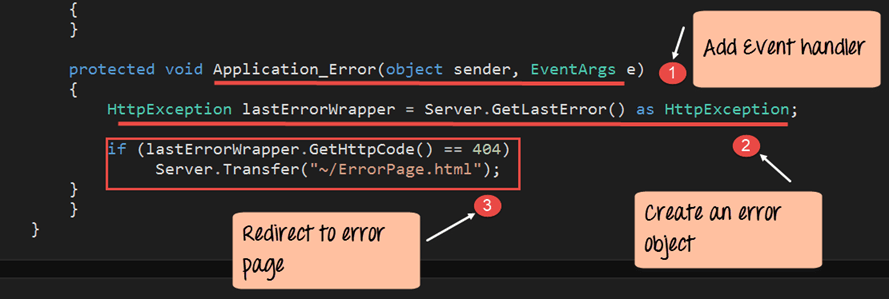
namespace DemoApplication
{
    public class Global : System.Web.HttpApplication
    {
        protected void Application_Error(object sender, EventArgs e)
        {
            HttpException lastErrorWrapper = Server.GetLastError() as HttpException;

            if (lastErrorWrapper.GetHttpCode() == 404)
                Server.Transfer("~/ErrorPage.html");
        }
    }
}
Code Explanation:-
- The first line is the Application_Error event handler. This event is called whenever an error occurs in an application. Note that the event name has to be Application_Error, and the parameters should be as shown above.
- Next, we define an object of the class type HttpException. This is a standard object which will hold all the details of the error. We then use the Server.GetLastError method to get all the details of the last error which occurred in the application.
- We then check if the error code of the last error is 404 (the error code 404 is the standard code returned when a user browses to a page which is not found). We then transfer the user to the ErrorPage.html page if the error code matches.
Now run the code in Visual Studio and you should get the below output.
Output:-
Browse the page http://localhost:53003/Demo1.aspx. Remember that Demo1.aspx does not exist in our application. You will then get the below output.

The above page shows that an error was triggered in the application. As a result, the ErrorPage.html page is displayed to the user.
ASP.NET Error Logging
By logging application errors, it helps the developer to debug and resolve the error at a later point in time. ASP.NET has the facility to log errors. This is done in the Global.asax.cs file when the error is captured. During the capturing process, the error message can be written into a log file.
Let us see an example of this.
- We are going to use our same DemoApplication which has the ErrorPage.html.
- And we will try to view a web page which does not exist in our application.
- We should be redirected to our ErrorPage.html page in this case.
- And at the same time, we will write the error message to a log file. Let us see the steps to achieve this.
Step 1) Let us work on our DemoApplication. Open the Global.asax.cs file from the Solution Explorer.

Step 2) Add the below line of code to the Global.asax.cs. It will check for errors and display the ErrorPage.html page accordingly. Also, at the same time, we will log the error details in a file called AllErrors.txt. For our example, we will write code to have this file created on the D drive.

namespace DemoApplication
{
    public class Global : System.Web.HttpApplication
    {
        protected void Application_Error(object sender, EventArgs e)
        {
            Exception exc = Server.GetLastError();
            String str = "";
            str = exc.Message;

            String path = @"D:\AllErrors.txt";
            File.WriteAllText(path, str);
            Server.Transfer("~/ErrorPage.html");
        }
    }
}
Code Explanation:-
- The first line is to get the error itself by using the Server.GetLastError method. This is then assigned to the variable exc.
- We then create an empty string variable called str. We get the actual error message using the exc.Message property. The exc.Message property will have the exact message for any error which occurs when running the application. This is then assigned to the string variable.
- Next, we define the file called AllErrors.txt. This is where all the error messages will be sent. We write the string str which contains all the error messages to this file.
- Finally, we transfer the user to the ErrorPage.html file.
Output:-
Browse the page http://localhost:53003/Demo1.aspx. Remember that Demo1.aspx does not exist in our application. You will then get the below output.

And at the same time, if you open the AllErrors.txt file you will see the below information.

The error message can then be passed on to the developer at a later point in time for debugging purposes.