
State Transition Testing with Example
 Editorial Team
⚡ Smart Summary
State Transition Testing is a black-box technique that validates how an application moves between states as input conditions change. This tutorial explains the four diagram parts, the difference between state diagrams and tables, and worked ATM and login examples for testers.

What is State Transition Testing?
State Transition Testing is a black-box testing technique in which changes in input conditions cause state changes or output changes in the Application Under Test (AUT). It helps analyze the behavior of an application for different input conditions, and testers can provide positive and negative input values while recording the system’s behavior.
It is based on the model on which the system and the tests are built. Any system where you get a different output for the same input — depending on what happened before — is a finite-state system. The State Transition Testing technique is helpful where you need to test different system transitions.
When to Use State Transition Testing
- When a tester is testing the application for a finite set of input values.
- When the tester is testing a sequence of events that occur in the AUT, allowing the application’s behavior to be checked for a sequence of input values.
- When the system under test depends on events or values from the past.
When Not to Rely on State Transition Testing
- When the testing is not done for sequential input combinations.
- When the testing targets different functionalities, such as exploratory testing.



Four Parts of a State Transition Diagram
There are four main components of the State Transition model, described below.
1) States that the software might reach.

2) Transition from one state to another.

3) Events that trigger a transition, such as closing a file or withdrawing money.

4) Actions that result from a transition, such as an error message or being given cash.

State Transition Diagram vs State Transition Table
There are two main ways to represent or design state transition: the state transition diagram and the state transition table.
| Aspect | State Transition Diagram | State Transition Table |
|---|---|---|
| Also called | State Chart / Graph | State Table |
| Representation | Boxes for states, arrows for transitions | Grid of states (rows) and events (columns) |
| Best for identifying | Valid transitions | Invalid transitions |
| Each cell shows | — | The state reached after an event occurs |
How to Make a State Transition (Examples)
Example 1: ATM PIN Lockout
Consider an ATM system function where, if the user enters the invalid password three times, the account is locked.
In this system, if the user enters a valid password in any of the first three attempts, the user is logged in successfully. If the user enters the invalid password on the first or second try, they are asked to re-enter it. Finally, if the user enters the incorrect password a third time, the account is blocked.
State Transition Diagram (Example 1)

In the diagram, whenever the user enters the correct PIN, they move to the Access Granted state. If they enter the wrong password, they move to the next try, and if they do the same a third time, the Account Blocked state is reached.
State Transition Table (Example 1)
| State | Correct PIN | Incorrect PIN |
|---|---|---|
| S1) Start | S5 | S2 |
| S2) 1st attempt | S5 | S3 |
| S3) 2nd attempt | S5 | S4 |
| S4) 3rd attempt | S5 | S6 |
| S5) Access Granted | – | – |
| S6) Account Blocked | – | – |
In the table, when the user enters the correct PIN, the state transitions to S5 (Access Granted). If the user enters a wrong password, they move to the next state, and after the third wrong attempt they reach the Account Blocked state.
Example 2: Flight Reservation Login
In the flight reservation login screen, you must enter the correct agent name and password to access the flight reservation application.
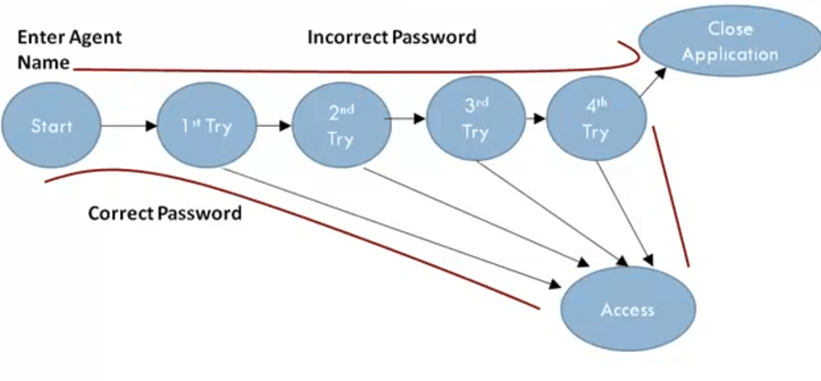
State Transition Graph
The application allows three attempts; if the user enters the wrong password on the fourth attempt, the system closes the application automatically.
The State Graph helps you determine valid transitions to be tested. Testing with both the correct and an incorrect password is compulsory, and for the test scenarios, logging in on the 2nd, 3rd, or 4th attempt could each be tested. You can use a State Table to determine invalid system transitions.

In a State Table, all valid states are listed on the left and the events that cause them across the top. Each cell shows the state the system moves to when the event occurs. For example, in state S1, a correct password takes you to S6 (Access Granted); a wrong password on the first attempt takes you to S3 (2nd Try). Likewise, you can determine all other states.
Two invalid states are highlighted using this method. Suppose you are in state S6 (already logged in) and you open another instance of flight reservation and enter passwords for the same agent. The system response for such a scenario needs to be tested.
Advantages and Disadvantages of State Transition Technique
| Advantages | Disadvantages |
|---|---|
| Provides a pictorial or tabular representation of system behavior, helping the tester cover and understand the system effectively. | Cannot be relied on every time — for example, it does not suit systems that are not finite or sequential. |
| Lets the tester verify that all conditions are covered and the results are captured. | Requires defining all possible states. This works for small systems but breaks down for larger ones due to the exponential growth in the number of states. |
