
SAP HANA Reporting Tool: How to Create Universe Using IDT?
 Editorial Team
⚡ Smart Summary
SAP HANA Reporting connects business intelligence front-end tools directly to HANA information views for real-time analysis. Reports can be built in SAP BI, Web Intelligence, Crystal Reports, SAP Lumira, and Microsoft Excel, each consuming HANA data through the HANA client drivers.

SAP HANA Reporting
We have till now loaded data from SAP source, non-SAP, and flat file through SAP SLT and SAP BODS, and created information views (attribute view, analytic view, and calculation view).
Now we will discuss the information view in reporting tools. The drivers like JDBC, ODBC, and ODBO in a reporting tool are part of the SAP HANA client.
So installing the SAP HANA client software (the *.exe file) makes all the drivers available on the PC for connecting reporting tools to SAP HANA.
We will use SAP BO, SAP Lumira, and Microsoft Excel to access an SAP HANA information view in this tutorial. The choice of reporting tool depends on the type of reports required.
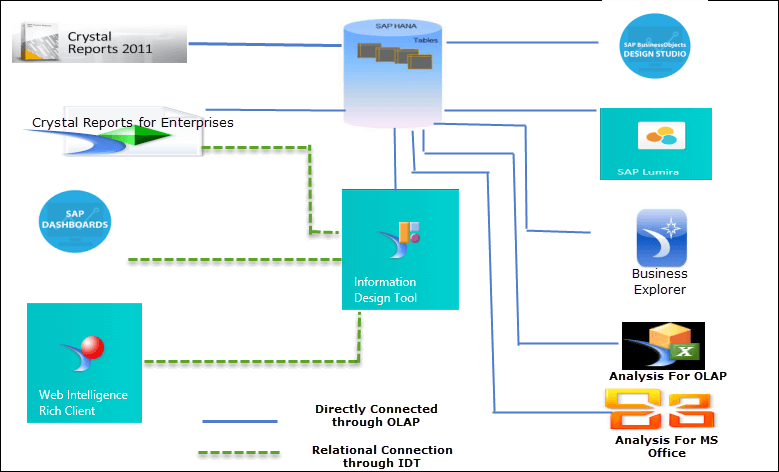
Reporting in SAP BI (Business Intelligence) Overview
SAP BI is a data warehousing and reporting tool.
In BI (Business Intelligence) raw data is cleaned, business logic is applied, and it is processed to provide meaningful information to the user. BI is an SAP product that provides a user-friendly environment.
SAP BI supports many databases, but when we migrate from source data to SAP HANA, the architecture is as below.
SAP BI is a three-tier architecture:
- Database Server – data is physically stored in PSA, ODS, and InfoCube.
- Application Server – used to access data from the database server and process it for the presentation server.
- Presentation Server – displays the data to the user.
The SAP BEx Query Designer (a component of SAP BI) can access an SAP HANA view as an InfoProvider and display data in BEx.

Reporting in Webi of SAP Business Object (BO) from HANA
SAP BusinessObjects Web Intelligence (SAP BO Webi) is part of the SAP BusinessObjects Platform (SBOP) client tools family. SAP BusinessObjects tools use the JDBC/ODBC driver to connect to the source system.
The features of SAP BO Webi are:
- Webi is an ad-hoc reporting tool.
- Webi is used for detail-level reports.
- Webi displays the result in tabular or graphical formats.
- Users can create or modify their own queries for the report.
After installing the SAP HANA client, the JDBC/ODBC driver is installed on the PC. These drivers act as an intermediary between SAP HANA and the client reporting tools when presenting data to the user.
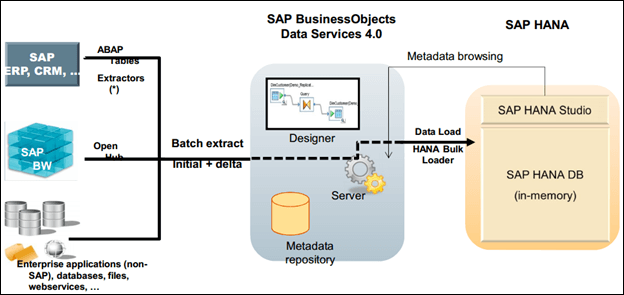
SAP BO Server and SAP BO Platform (SBOP) client tools.
How to Create a Universe in SAP HANA Using the Information Design Tool
Step 1) Create a universe. In this step, we create a universe using the Information Design Tool (IDT).
HANA can be accessed via ODBC and JDBC drivers, and its tables can be defined and queried with SQL language. Tables are managed with a tool called HANA Studio.
- Launch IDT by navigating to
Start Menu -> SAP Business Intelligence -> SAP BusinessObjects BI platform 4 Client Tools -> Information Design Tool

The Information Design Tool screen appears. To create a universe we need a project in IDT.
- Navigate to the Project option as below:
- Click on File.
- Click on New.
- Select Project.

Or
- Click on the New File icon.
- Select Project.


A pop-up for New Project appears. In this pop-up, enter the following details:
1. Enter the name of the project.
2. Click on the Finish button.
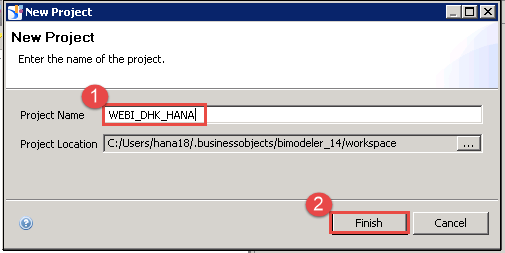
The project name “WEBI_DHK_HANA” appears under the Local Projects tab as below.

A project is a local workspace where you store the resources used to build one or more universes.
There are two connections available, detailed as below:
- Relational Connection – to access data from a table and access a regular RDBMS, use a relational connection.
- OLAP Connection – to access data from an application (SAP, Oracle, Microsoft, SAP BO) and data stored in a cube or information view, use an OLAP connection.
Step 2) Create a relational connection. Now we create a relational connection. Go to Project -> New -> Relational Connection.
A pop-up for the new relational connection source name appears:
- Enter the resource name.
- Click on the Next button.

A pop-up for Database Middleware Driver Selection appears:
- Select JDBC Drivers under SAP HANA Database 1.0.
- Click on the Next button.

A pop-up for the new relational connection parameters is displayed. Enter the following details:
- Authentication Mode is selected as “Use Specified User Name and Password”.
- Enter the HANA user name.
- Enter the password.
- Select Single Server in the Data Source section. Enter the host name (here best: 30015).
- Enter the instance number.
- Click on the Test Connection button to verify the connection.

A pop-up for Test Connection successful is displayed.

After a successful connection, a connection with the name SAP HANA.cnx is created.
Step 3) Publish the connection. To consume the universe by Web Intelligence, Dashboards, or Crystal Report for Enterprise, we need to publish the connection. So now we publish the connection for SAP HANA.cnx.
- Select the SAP HANA.cnx connection under the project “WEBI_DHK_HANA” and right-click.
- Select Publish Connection to a Repository.
- A published connection with the name SAPHANA.cns is created after a successful publish in the repository.

A pop-up for publishing the connection to the repository appears:
- Select Business IDT.
- Click on the Finish button.

A pop-up “The connection was published successfully” is displayed.

Now we create the universe using the SAP HANA business layer.
Step 4) Create the universe using the HANA layer. A universe is a business representation of your data warehouse or transactional database that allows the user to interact with data without knowledge of the complexities of the database.
To create the universe, we use the SAP HANA business layer as below.
SAP HANA Business Layer
From SAP BOBI 4.1, SAP provides a new option “SAP HANA Business Layer” while creating the universe using the Information Design Tool.
Before SAP BOBI 4.1, we needed to create a derived table while building the data foundation and map the variables and input parameters.
The SAP HANA business layer automatically creates a data foundation and business layer based on the selected SAP HANA views, and automatically detects the input parameters and variables.
We create the universe through the SAP HANA business layer as below:
- Select the created project “WEBI_DHK_HANA”.
- Right-click the project and select New.
- Select “SAP HANA Business Layer”.
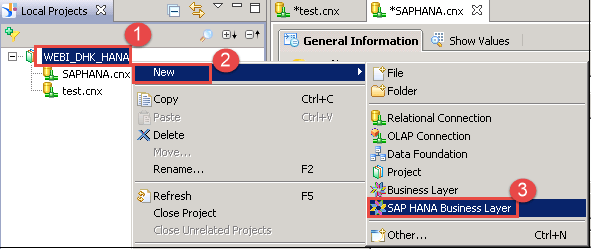
A pop-up for SAP HANA Business Layer appears:
- Enter the business layer name.
- Enter the data foundation name.
- Enter the description.
- Click on the Next button.

A pop-up for Select SAP HANA Connection is displayed:
- Tick the connection “SAPHANA.cnx”.
- Click on the Next button.

A pop-up for selecting the SAP HANA information model is displayed:
- Now select the analytic view (AN_PURCHASE_ORDERS) created under the HANAUSER package.
- Click on the Finish button.

The analytic view opens in the Information Design Tool.
Step 5) Check details. The Information Design Tool detail is as below:
- Under Project, all relational connections, business layers, and data foundations are displayed.
- In the repository resource section, objects (connection, business layer, etc.) stored in the repository are displayed.
- Business Layer shows the business view of the analytic view. It is for the functional person.
- Data Foundation shows the table and column names. It is for the technical person.

Step 6) Select the layer section. Select the business layer section and go to the folder with the name of the analytic view. Now follow the points as below:
- Select the data foundation section.
- Drag and drop a column to the analytic view.
- It displays objects under the analytic view.
- The dragged field is displayed under the analytic view (AN_PURCHASE_ORDER).


Step 7) Save the objects. In this step, save all objects. Go to File and click on “Save All” to save all objects.

After that, follow the step below.
Step 8) Check the output. Create a query and view the output.
- Go to the Queries option.
- A query panel is displayed. Select the field you want to include in the query.
- Drag and drop them into the “Result Objects for Query #1” section.
- Click on the Refresh button in the result set section.
- The result is displayed.

Reporting in SAP Crystal Report
SAP Crystal Report helps us design, explore, visualize, and provide reports that can run on web or enterprise applications. With SAP Crystal Report we can create a simple report or a complex report.

There are two types of SAP Crystal Reports:
- Crystal Report 2011/13/16: used when
- You want to call a HANA stored procedure from Crystal Reports.
- You want to create SQL expressions.
- You want to execute a view with parameters or variables and submit non-default values.
- Crystal Report for Enterprises: used when
- A universe is available or needed; then use SAP Crystal Reports Enterprise.
We will use Crystal Reports for Enterprises.
Step 1) Log in to Crystal Report for Enterprises.

SAP Crystal Reports for Enterprises is displayed as below:
- It is the report formatting section, which provides different tools for formatting.
- This is an icon for the window (Data Explorer, Outline, Group Tree, Find).
- Details of Data Explorer, Outline, Group Tree, Find, etc. are displayed.
- Report Page Formatting option.
- Work area for the report.

Step 2) Now we create a connection for the data source. Click on Choose Data Source from Data Explorer.

A pop-up for Choose a Data Source Type is displayed. Select Browse from the SAP HANA Platform section.

A pop-up for connecting to the server is displayed. Click on the “New Server” button.

A window for server connection is displayed as below:
- Click on the Add button.
- Enter the connection display name (saphana).
- A connection name appears in the connection list.
- Enter the HANA server name.
- Enter the HANA server instance name.
- Enter the HANA username.
- Click on the “Test Connection” button.
- A pop-up for Test Connection logon appears. Enter the password for the SAP HANA user.
- Click on the OK button.

A message for connection successful is displayed.

Click on the OK button. A pop-up for connecting to the server is displayed.
Step 3) In this step,
- We do the following:
- Select server “saphana”.
- Click on the OK button.

A pop-up for entering a password is displayed. Enter the password and then click OK.

One more pop-up appears for selecting the HANA view.
2) In this step, we select the SAP HANA view.
- Select the HANA view (Analytic View AN_PURCHASE_ORDERS).
- Click on the OK button.

- In this step, a window for the query opens.
Follow the points below to create a query:
- Select the required column from the list for the query.
- Drag and drop the required field into the query.
- Click on the Refresh button.
- The result set is displayed.
- Click on the
 button.
 button.
The report output is displayed as below:

Reporting in SAP Lumira
SAP Lumira is software by SAP to analyze and visualize data. With SAP Lumira, the user can create beautiful and interactive maps, infographics, and charts. SAP Lumira can import data from Excel and other sources.
SAP Lumira can access an information view of SAP HANA directly, performing visual BI analysis using a dashboard.
Note: SAP Lumira has reached end of mainstream maintenance, and SAP positions SAP Analytics Cloud as its strategic successor for new self-service visualization work. The steps below still apply to existing Lumira installations.
In SAP Lumira, the following steps are done to visualize data.

Now we visualize an SAP HANA view in SAP Lumira. First we log in to SAP Lumira by clicking the SAP Lumira Client icon on the desktop as below.

Step 1) Create a document and acquire a data set. After SAP Lumira opens, a screen opens to work on. The detail about this screen is as below:
- Application Toolbar – contains toolbars like File, Edit, View, Data, and Help.
- Home Link – using this option we can go to the home screen.
- My Documents sections:
- Documents
- Visualizations
- Datasets
- Stories
- SAP Lumira Cloud – using this option we can use cloud options.
- Connections – we can see all connections here.

Click on the Document option in the My Items section to create a document:
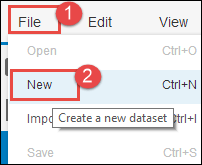
- Go to the File application toolbar and click on File.
- Select New.
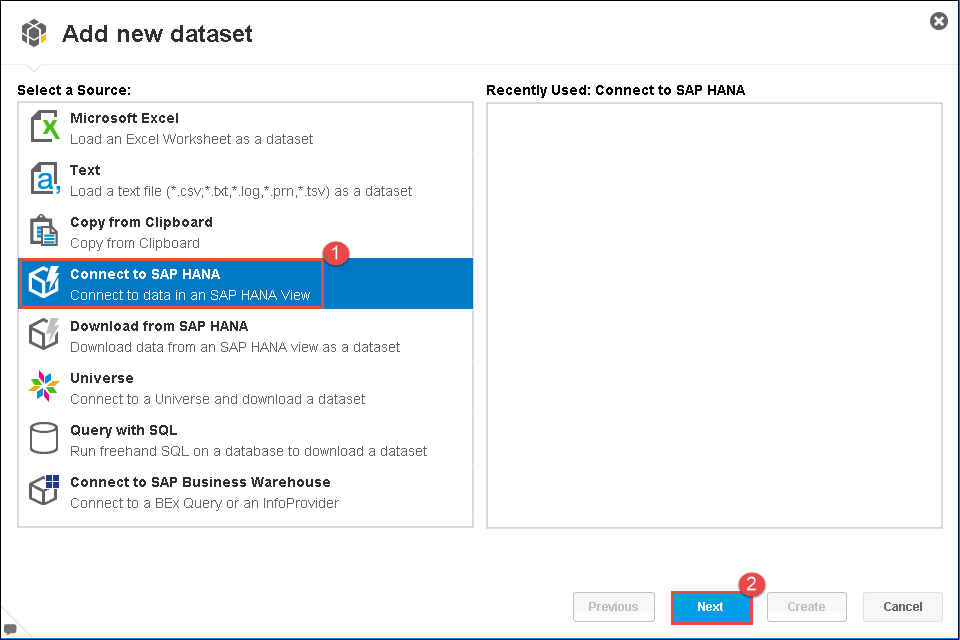
SAP Lumira supports the datasets below:
- Microsoft Excel
- Text
- Copy from clipboard
- Connect to SAP HANA
- Download from SAP HANA
- Universe
- Query with SQL
- Connect to SAP Business Warehouse
- SAP Universe Query Panel
Step 2) Connect to SAP HANA. Here we connect to SAP HANA and access an SAP HANA information view.
- Select Connect to SAP HANA.
- Click on the Next button.
A pop-up for SAP HANA server credentials is displayed as below:
- Enter the SAP HANA server name.
- Enter the SAP HANA instance number.
- Enter the SAP HANA user name.
- Enter the SAP HANA password.
- Click on the “Connect” button to connect to the SAP HANA server.

After clicking the Connect button, we connect to SAP HANA and can access the SAP HANA view.
Step 3) Access the SAP HANA analytic view. A window to select the SAP HANA view appears as below:
- Select the SAP HANA view (“AN_PURCHASE_ORDERS” here).
- Click on the Next button.

Step 4) Define dimension and measure. The next window to select measures and dimensions is displayed:
- All measures are grouped under the Measures section.
- All dimensions are grouped under the Dimensions section.
- Click on the Create button.

Step 5) Visualize the SAP HANA analytic view in SAP Lumira. After activating an information view in SAP HANA, a column view with a name similar to the information view is created under the “_SYS_BIC” schema in the SAP HANA catalog node.
When we need to access any SAP HANA information view from outside SAP HANA, we can access it only from the “_SYS_BIC” schema.
A visualize screen appears, which selects the column view under the “_SYS_BIC” schema:
- Different chart types can be selected from the Chart Builder section.
- Click on the Chart Builder icon.
- Select the Column Chart option.

- Click on the “+” icon in front of the Measures section to add a measure in the Y-axis format.
- We have added the “GROSS_AMOUNT” and “TAX_AMOUNT” measures.
- Click on the icon in front of the “Dimensions” section. A list of all available dimensions appears.
- Select “CATEGORY”, “PRODUCT_ID”, and “PRODUCT_NAME” from the dimension list to display on the X-axis.


The SAP HANA analytic view is displayed in the Visualize tab of SAP Lumira, which has different screens as below:
- Tool for ascending/descending, ranking, clear, refresh, etc.
- This can be used for filtering.
- The output of the SAP HANA analytic view in SAP Lumira.

Reporting in Microsoft Excel
Microsoft Excel has a powerful built-in reporting option; we can create a report quickly using pivot tables and charts.
MS Office uses the MDX language (Multi Dimension Expression language) to access data from SAP HANA.
The MDX language is used by a reporting tool to access data from a multi-dimensional object in a database environment. Only with an MDX query can we access SAP HANA hierarchies.
We can access only an SAP HANA information view that has the property ‘CUBE’ in its semantics, so we cannot access an attribute view from MS Excel.
Connecting drivers: MS Excel uses ODBO (OLE DB for OLAP) drivers for connecting to the SAP HANA database.

Now we access the SAP HANA database from Excel as shown in the steps below.
Step 1) Connect to SAP HANA from Excel.
- Open MS Excel. Go to the Data tab.
- Click on the “From Other Sources” icon.
- Select From Data Connection Wizard.

A screen for the Data Connection Wizard is displayed as below:
- Select “Other/Advanced”.
- Click on the Next button.

A window for “Data Link Properties” opens as below:
- Select “SAP HANA MDX Provider” under the Provider tab.
- Click on the Next button.

A window for data link properties is displayed. Enter the following details:
- Enter the host name of the SAP HANA database.
- Enter the instance number of the SAP HANA database.
- Enter the username and password for the SAP HANA database.
- Enter the language name.
- Click on “Test Connection” to test the connection to the SAP HANA database from Excel.

A message “Test connection succeeded” pops up.

Click on the OK button.
Step 2) Until now we have created a connection from Excel to SAP HANA and tested it. Now we access an SAP HANA information view from Excel. A window for the “Data Connection Wizard” is displayed.
- Select the package that contains the SAP HANA information view.
- Select the information view (analytic view, calculation view).
- Click on the Next button.

A new window for the data connection file appears. Enter the following details:
1. Give the file name (AV_SALES).
2. Tick “Save password in file” to avoid entering a password while opening the Excel file.
3. A pop-up for save-password security appears.
4. Click on the Finish button.


Step 3) Now the SAP HANA information view is displayed in Excel as a pivot table as below:

