
Selenium IDE Tutorial
 Krishna Rungta
⚡ Smart Summary
Selenium IDE is the record-and-playback tool of the Selenium suite, built for prototyping tests rather than maintaining large suites, and its panes cover recording, editing, running and inspecting every Selenese command.
What is Selenium IDE?
Selenium IDE (Integrated Development Environment) is the simplest tool in the Selenium Suite. It is a Firefox add-on that creates tests very quickly through its record-and-playback functionality. This feature is similar to that of QTP. It is effortless to install and easy to learn.
⚠️ A note on versions: the Firefox add-on pictured throughout this article was retired. The tool lives on as a Chrome, Firefox and Edge browser extension that keeps record-and-playback but rearranges the interface and saves a project as a single .side file. Every original screen and setting below is preserved as published.
Because of its simplicity, Selenium IDE should only be used as a prototyping tool, not an overall solution for developing and maintaining complex test suites.
Though you will be able to use Selenium IDE without prior knowledge in programming, you should at least be familiar with HTML, JavaScript, and the DOM (Document Object Model) to utilize this tool to its full potential. Knowledge of JavaScript will be required when we get to the section about the Selenese command “runScript.”
Selenium IDE supports autocomplete mode when creating tests. This feature serves two purposes:
- It helps the tester to enter commands more quickly.
- It restricts the user from entering invalid commands.
Selenium IDE Features
The labelled screen below identifies every region referenced in the rest of this article.

Menu Bar
It is located at the top most portion of the IDE. The most commonly used menus are the File, Edit, and Options menus.
File menu
- It contains options to create, open, save and close tests.
- Tests are saved in HTML format.
- The most useful option is “Export” because it allows you to turn your Selenium IDE test cases into file formats that can run on Selenium Remote Control and WebDriver
- “Export Test Case As…” will export only the currently opened test case.
- “Export Test Suite As…” will export all the test cases in the currently opened test suite.
The expanded File menu below shows both export entries side by side.

- As of Selenium IDE v1.9.1, test cases can be exported only to the following formats:
- .cs (C# source code)
- .java (Java source code)
- .py (Python source code)
- .rb (Ruby source code)
Exporting rewrites each Selenese row as a statement in the chosen language, as this HTML-to-Java comparison shows.

Note: Selenium Remote Control was removed in Selenium 3, so an exported RC script no longer runs. The current IDE exports WebDriver code instead.
Edit Menu
- It contains usual options like Undo, Redo, Cut, Copy, Paste, Delete, and Select All.
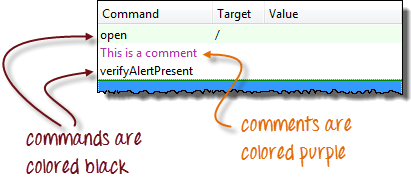
- The two most important options are the “Insert New Command” and “Insert New Comment”.

The newly inserted command or comment will be placed on top of the currently selected line.

- Commands are colored black.
- Comments are colored purple.
The colour difference makes an inserted comment easy to pick out in a long script.
Options menu
It provides the interface for configuring various settings of Selenium IDE.
We shall concentrate on the Options and Clipboard Format options.
|
|
Clipboard Format
|

For example, when you choose Java/JUnit 4/WebDriver as your clipboard format, every Selenese command you copy from Selenium IDE’s editor will be pasted as Java code. See the illustration below.

Selenium IDE Options dialog box
You can launch the Selenium IDE Options dialog box by clicking Options > Options… on the menu bar. Though there are many settings available, we will concentrate on the few important ones.

- Default Timeout Value. This refers to the time that Selenium has to wait for a certain element to appear or become accessible before it generates an error. Default timeout value is 30000ms.
- Selenium IDE extensions. This is where you specify the extensions you want to use to extend Selenium IDE’s capabilities. You can visit addons.mozilla.org and use “Selenium” as a keyword to search for the specific extensions.
- Remember base URL. Keep this checked if you want Selenium IDE to remember the Base URL every time you launch it. If you uncheck this, Selenium IDE will always launch with a blank value for the Base URL.
- Autostart record. If you check this, Selenium IDE will immediately record your browser actions upon startup.
- Locator builders. This is where you specify the order by which locators are generated while recording. Locators are ways to tell Selenium IDE which UI element should a Selenese command act upon. In the setup below, when you click on an element with an ID attribute, that element’s ID will be used as the locator since “id” is the first one in the list. If that element does not have an ID attribute, Selenium will next look for the “name” attribute since it is second in the list. The list goes on and on until an appropriate one is found.
Dragging an entry up or down this list changes which attribute the recorder reaches for first.
.png)
Base URL Bar
Every relative address in a script is resolved against this field.

- It has a dropdown menu that remembers all previous values for easy access.
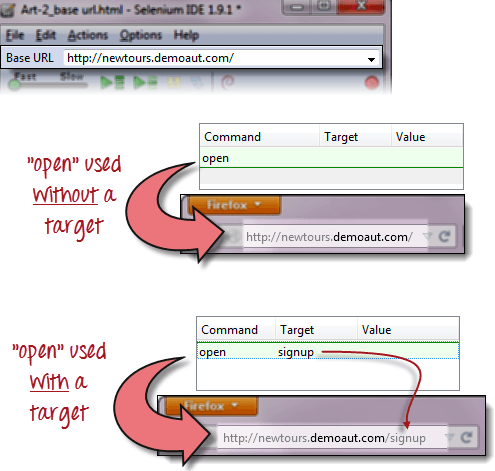
- The Selenese command “open” will take you to the URL that you specified in the Base URL.
- In this tutorial series, we will be using demo.guru99.com/test/newtours/ as our Base URL. It is the site for Mercury Tours, a demo web application used here for web testing purposes. We shall be using this application because it contains a complete set of elements that we need for the succeeding topics.
- The Base URL is very useful in accessing relative URLs. Suppose that your Base URL is set to the Mercury Tours address above. When you execute the command “open” with the target value “signup,” Selenium IDE will direct the browser to the sign-up page. See the illustration below.
Toolbar
The toolbar holds the recording and playback controls. Each button and what it does is listed below.
 |
Playback Speed. This controls the speed of your Test Script Execution. |
 |
Record. This starts/ends your recording session. Each browser action is entered as a Selenese command in the Editor. |
 |
Play entire test suite. This will sequentially play all the test cases listed in the Test Case Pane. |
 |
Play current test case. This will play only the currently selected test case in the Test Case Pane. |
 |
Pause/Resume. This will pause or resume your playback. |
 |
Step. This button will allow you to step into each command in your test script. |
 |
Apply rollup rules. This is an advanced functionality. It allows you to group Selenese commands together and execute them as a single action. |
Test Case Pane
|
|
|

Editor
You can think of the editor as the place where all the action happens. It is available in two views: Table and Source.
Table View
- Most of the time, you will work on Selenium IDE using the Table View.
- This is where you create and modify Selenese commands.
- After playback, each step is color-coded.

- To create steps, type the name of the command in the “Command” text box.
- It displays a dropdown list of commands that match with the entry that you are currently typing.
- Target is any parameter (like username, password) for a command and Value is the input value (like tom, 123pass) for those Targets.

Source View
- It displays the steps in HTML (default) format.
- It also allows you to edit your script just like in the Table View.

Log Pane
The Log Pane displays runtime messages during execution. It provides real-time updates as to what Selenium IDE is doing.
Logs are categorized into four types:
- Debug – By default, Debug messages are not displayed in the log panel. They show up only when you filter them. They provide technical information about what Selenium IDE is doing behind the scenes. It may display messages such as a specific module has done loading, a certain function is called, or an external JavaScript file was loaded as an extension.
- Info – It says which command Selenium IDE is currently executing.
- Warn – These are warning messages that are encountered in special situations.
- Error – These are error messages generated when Selenium IDE fails to execute a command, or if a condition specified by “verify” or “assert” command is not met.

Logs can be filtered by type. For example, if you choose to select the “Error” option from the dropdown list, the Log Pane will show error messages only.

Reference Pane
The Reference Pane shows a concise description of the currently selected Selenese command in the Editor. It also shows the description about the locator and value to be used on that command.

UI-Element Pane
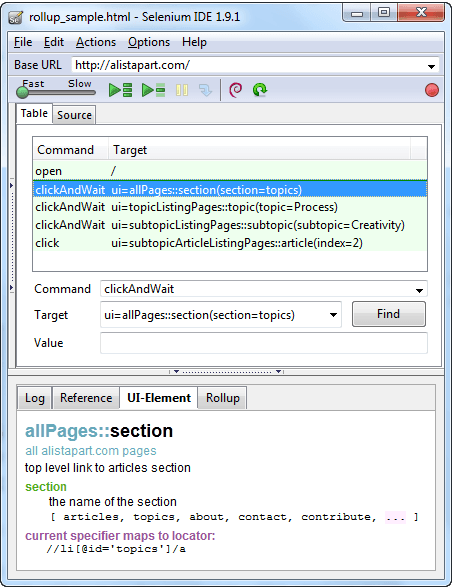
The UI-Element is for advanced Selenium users. It uses JavaScript Object Notation (JSON) to define element mappings. The documentation and resources are found in the “UI Element Documentation” option under the Help menu of Selenium IDE.

An example of a UI-element screen is shown below.
Rollup Pane
Rollup allows you to execute a group of commands in one step. A group of commands is simply called as a “rollup.” It employs heavy use of JavaScript and UI-Element concepts to formulate a collection of commands that is similar to a “function” in programming languages.
Rollups are reusable; meaning, they can be used multiple times within the test case. Since rollups are groups of commands condensed into one, they contribute a lot in shortening your test script.
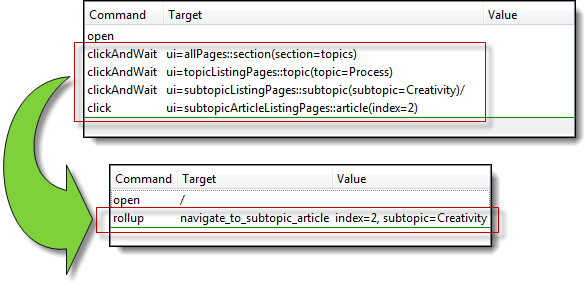
An example of how the contents of the rollup tab look like is shown below.

The rollup and UI-Element panes have no counterpart in the current extension; control-flow commands and code export fill that role now.
