
How to Download and Install Selenium IDE for Firefox & Chrome
 Krishna Rungta
⚡ Smart Summary
Selenium IDE installs as a browser extension rather than a standalone application, so the whole setup is an add-on download in Firefox or Chrome followed by a single click to open the recorder.
In this tutorial, we will learn how to download and install Selenium IDE for Firefox and Google Chrome. Nothing is compiled and nothing is placed on the system path — the IDE is a browser extension, so the install is finished the moment the browser reports that the add-on has been added.
⚠️ A note on versions: the screenshots below come from the original Firefox-plugin Selenium IDE. That build stopped working when Firefox 55 removed support for legacy XUL add-ons in 2017. The Selenium IDE distributed today is a rewritten extension for Firefox and Chrome that saves projects in the .side format instead of HTML. Every original step is preserved here, with the current behaviour noted beside it.
How to Install Selenium IDE for Firefox
Below is a step by step process on how to download and install Selenium IDE for Firefox:
What you need
- Mozilla Firefox
- Active Internet Connection
If you do not have Mozilla Firefox yet, you can download it from firefox.com.
Steps 1) Open Firefox Add-ons & Download Selenium IDE
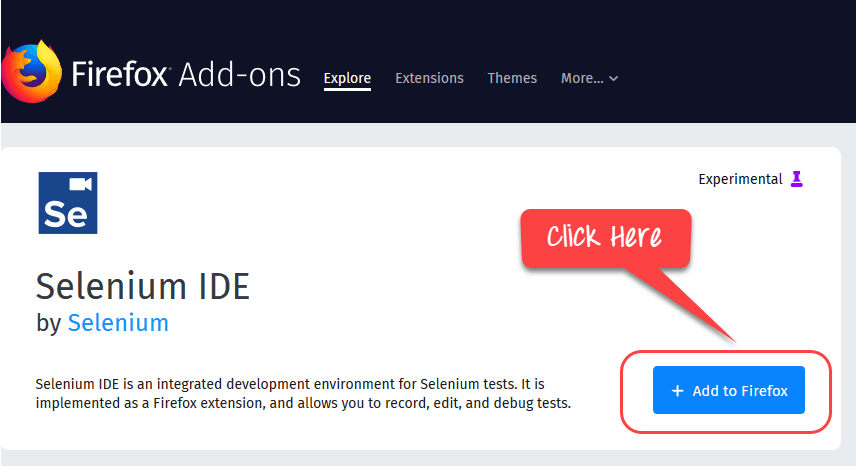
Launch Firefox and navigate to the Selenium IDE listing on Firefox Add-ons. Click on Add to Firefox. The add-on page looks like the screenshot below.
Steps 2) Click on Add
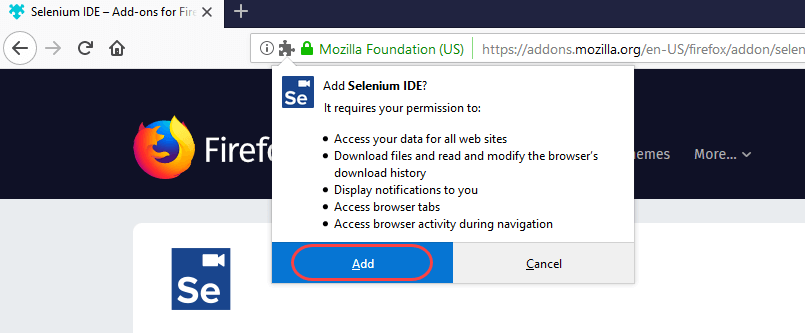
Wait until Firefox completes the download and then click “Add.“ Firefox first shows the permission prompt below, which lists the access the extension is requesting.
Steps 3) Click on Ok
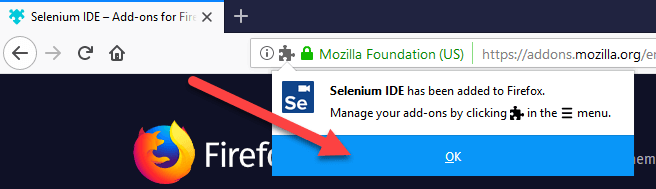
Once install is complete, you will get a confirmation message. Click “OK” on the notification shown here.
Steps 4) Click & Open Selenium IDE
Click on the Selenium IDE icon, which now sits in the Firefox toolbar as shown below.

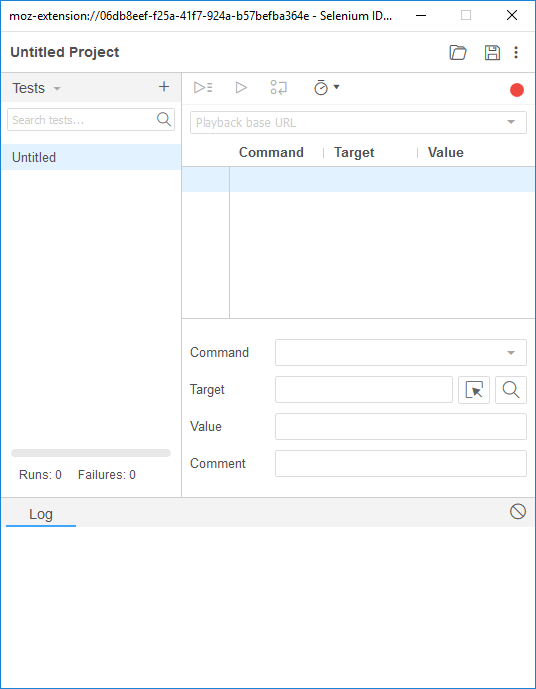
Selenium IDE will open in its own window, as in the next screenshot.
Firefox DevTools in Firefox
Installing the IDE is only half of the setup. Recording a step is easy, but writing one by hand needs the identifier of the element the step acts on, and that comes from the browser’s own inspector.
Firefox DevTools is a Firefox feature that we will use to inspect the HTML elements of the web application under test. It will provide us the name of the element that our Selenese command would act upon.
Step 1) Right click anywhere on the page and select Inspect Element. You can also use shortcut Ctrl + Shift + I. The context menu is shown below.

Step 2) You will see the Interface pictured here, with the page markup on one side and the styles on the other.

Step 3) You can right click on an element and chose CSS or XPath. This is useful in object identification, because the copied value can be pasted straight into the Target field of a command.

Note: Likewise, you can also use Developer Tools in Chrome to identify object properties. The Chrome panel below performs the same job.
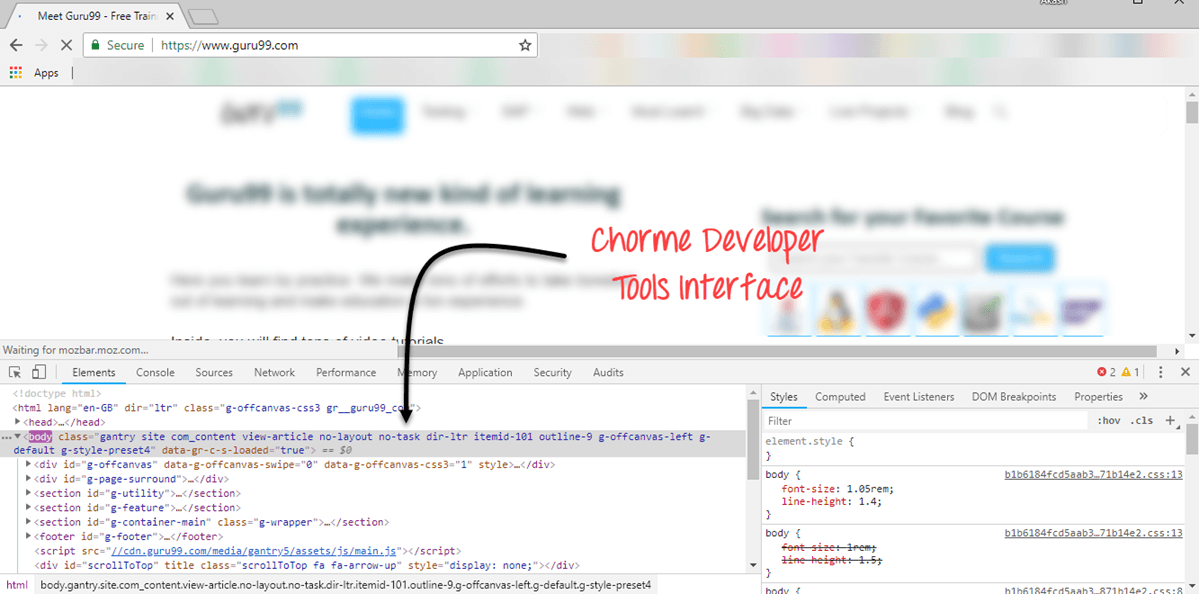
Both inspectors also expose the id, name and class attributes that the IDE prefers when it builds a locator during recording.
Selenium IDE was deprecated, and the development had stopped. Only recently the project has been resurrected. The new Selenium lacks many features compared to the deprecated IDE. Features are being added but at a slow pace. To explore all the features of Selenium IDE, we recommend you use the old version. To use the old version of IDE
Step 1) Use Firefox 54 Portable Version check here
Step 2) Visit the Selenium IDE version history and install. The version list looks like this.

The following features may not be available in latest IDE version. We will keep updating the tutorials as the new version is updated.
⚠️ Current status: running an unsupported browser purely to keep an unsupported add-on alive is no longer a practical option on a work machine, so treat the two steps above as historical context. The rebuilt IDE now covers most of what made the legacy tool useful, including stored variables, control-flow commands and code export.
Plugins
Selenium IDE can support additional Firefox add-ons or plugins created by other users. You can visit the official Selenium IDE site for a list of Selenium add-ons available to date. Install them just as you do with other Firefox add-ons.
By default, Selenium IDE comes bundled with 4 plugins:
- Selenium IDE: C# Formatters
- Selenium IDE: Java Formatters
- Selenium IDE: Python Formatters
- Selenium IDE: Ruby Formatters
These four plugins are required by Selenium IDE to convert Selenese into different formats.
The Plugins tab shows a list of all your installed add-ons, together with the version number and name of the creator of each, as in the screenshot below.

User Extensions
Selenium IDE can support user extensions to provide advanced capabilities. User extensions are in the form of JavaScript files. You install them by specifying their absolute path in either of these two fields in the Options dialog box.
- Selenium Core extensions (user-extensions.js)
- Selenium IDE extensions
The two path fields are highlighted in the Options dialog below.

You will be able to find tons of user extensions on the Selenium downloads page. Note that this mechanism belonged to Selenium Core, which was removed in Selenium 3; the modern IDE is extended through its own plugin API instead.
How to Install Selenium IDE in Chrome
Below is a step by step process on how to download and install Selenium IDE for Google Chrome:
Step 1) Go to the Selenium IDE site & Click the Chrome Download button.
Step 2) Open the Chrome Web Store listing for the Selenium IDE extension and install it.
Step 3) Click the Add to Chrome button to add the Selenium IDE to Google Chrome.
Step 4) Go to the Extensions menu, click on that icon, and open Selenium IDE to record a new test in a new project.
The Chrome build and the Firefox build are the same extension, so a project recorded in one opens in the other. Because browser stores change their listings over time, always start from the official site in Step 1 rather than from a bookmarked store URL.
How to Verify the Installation and Record a First Test
An extension that loads is not proof that the setup works. The quickest check is to record something trivial and play it back.
- Click the Selenium IDE icon. The welcome dialog offers four options: record a new test in a new project, open an existing project, create a new project, or close the IDE.
- Choose the first option and give the project a name.
- Enter a base URL. This is the address of the application under test, and it is reused by every test in the project.
- A new browser window opens on that URL and recording starts. Click a link or type into a field, then switch back to the IDE and click the recording icon to stop.
- Click the save icon. The IDE writes a single file with a
.sideextension. - Select the test and click play. If the recorded steps replay without a red failure marker, the installation is sound.
A first playback that fails on the very first command usually points at the base URL rather than at the install. A playback that fails midway is a locator problem, which is where the verify and wait commands earn their keep.
How to Fix Common Selenium IDE Installation Problems
Almost every install complaint falls into one of a handful of patterns. The first two are the ones documented by the Selenium project itself.
- No icon in the toolbar. Confirm the extension is enabled. Type
chrome://extensionsin Chrome, orabout:addonsin Firefox, and check that Selenium IDE is switched on. - The extension is enabled but still invisible. The icon may simply be hidden because the toolbar is too narrow. In Chrome, drag the area to the right of the address bar. In Firefox, right-click the toolbar, choose Customize, adjust it, and click Done.
- The IDE opens but records nothing. The recording window must be the one the IDE launched. Recording in a tab opened by hand is not captured.
- Nothing works on an internal page. Extensions cannot script browser-internal pages such as the settings or extensions screens, so record against an ordinary web page.
- A managed browser blocks the install. On a corporate profile, extension installation is often controlled by policy and needs an administrator to allow the extension ID.
How to Install the Selenium IDE Command-Line Runner
The extension plays tests back only in the browser it is installed in. To run a saved project on other browsers, in parallel, or on a Grid, install the command-line runner. It needs Node.js and npm.
npm install -g selenium-side-runner
Each browser also needs its own driver binary. Install the driver for the browser you intend to target.
npm install -g chromedriver
npm install -g geckodriver
npm install -g edgedriver
With the runner and a driver in place, point the runner at the project file that the IDE saved earlier.
selenium-side-runner /path/to/your-project.side
The runner spreads suites across as many processes as the machine has CPU cores. Two flags cover most day-to-day needs: -c sets the browser, and --base-url retargets the whole project at a different environment, which is what makes the same recording usable against a local build and a staging server.
selenium-side-runner -c "browserName=firefox" --base-url https://localhost
From here, the natural next step is to leave record-and-playback behind and write the same checks in code — see the first WebDriver script walkthrough and the wider Selenium series.
