Entity Relationship (ER) Diagram Model with DBMS Example
⚡ Smart Summary
The Entity Relationship (ER) Diagram Model with DBMS Example illustrates a structured method to visually represent data and its interconnections within relational databases. Proposed by Peter Chen, it provides a conceptual modeling foundation to define entities, attributes, relationships, and their cardinalities precisely.
What is an ER Diagram?
The Entity Relationship (ER) Diagram is a powerful visual tool for designing relational database structures. First proposed by Peter Chen in 1976, it provides a conceptual modeling foundation that defines entities, attributes, relationships, and their cardinalities with precision. This tutorial covers everything from basic concepts to advanced techniques, helping you master database schema design.
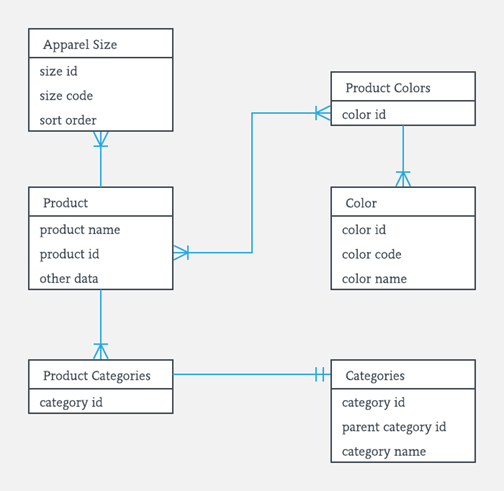
ER Diagrams contain different symbols that use rectangles to represent entities, ovals to define attributes, and diamond shapes to represent relationships.
At first glance, an ER Diagram looks very similar to a flowchart. However, an ER Diagram includes many specialized symbols, and its meanings make this model unique. The purpose of an ER Diagram is to represent the entity framework infrastructure.
History of ER Models
Peter Chen proposed the ER Diagram in 1976 in his seminal paper “The Entity-Relationship Model: Toward a Unified View of Data.” His goal was to create a uniform convention that could be used for both relational databases and networks. Chen envisioned the ER Model as a conceptual modeling approach that would bridge the gap between real-world requirements and technical database implementation.
Since then, the ER Model has evolved with various notation systems, including Chen Notation (the original), Crow’s Foot Notation (popular in modern tools), and UML-based approaches. Despite these variations, the core concepts remain consistent across all implementations.
Why Use ER Diagrams?
ER Diagrams provide numerous benefits for database design and development:
- Visual Communication: They provide a clear visual representation that both technical and non-technical stakeholders can understand.
- Blueprint for Development: They show exactly how tables should connect and what fields each table will contain.
- Translation Ready: ER Diagrams can be directly translated into relational tables, allowing you to build databases quickly.
- Error Prevention: They help identify design flaws and redundancies before implementation, saving time and resources.
- Documentation: They serve as lasting documentation that helps new team members understand the system architecture.
- System Analysis: They help identify all entities that exist in a system and the relationships between them.
ER Diagram Components
Every ER Diagram is built from three core components: Entities, Attributes, and Relationships. Understanding each component and how they interact is essential for creating effective database designs.
ER Diagram Examples
For example, in a University database, we might have entities for Students, Courses, and Lecturers. A student entity can have attributes like Rollno, Name, and DeptID. They might have relationships with Courses and Lecturers.
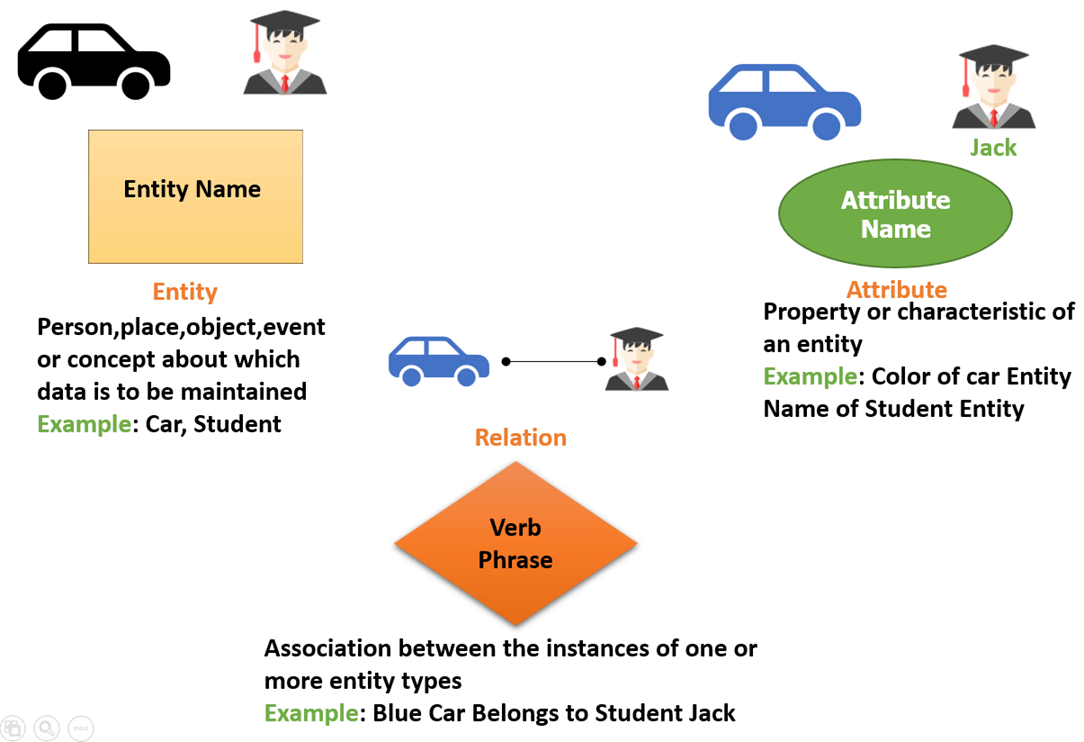
Entities
An entity represents any real-world object—living or non-living—that can be clearly identified and about which data can be stored. It may be a physical thing, a fact about the enterprise, or an event that happens in the real world. Entities can include people, places, objects, events, or concepts.
Examples of entities by category:
- Person: Employee, Student, Patient, Customer
- Place: Store, Building, Office, Warehouse
- Object: Machine, Product, Car, Book
- Event: Sale, Registration, Renewal, Transaction
- Concept: Account, Course, Department, Project

Entity Set
An entity set is a group of similar entities that share common attributes. For example, all students in a university form a “Student” entity set. Entities are represented in ER Diagrams using rectangles, with the entity name written inside.
Entities are represented by their properties, which are also called attributes. All attributes have their separate values. For example, a student entity may have a name, age, and class as attributes.
Strong Entities vs. Weak Entities
Entities are classified as either strong or weak based on their ability to exist independently. Understanding this distinction is crucial for proper database design.
A strong entity has its own primary key and can exist independently. For example, a “Student” entity can be uniquely identified by Student_ID without depending on any other entity.
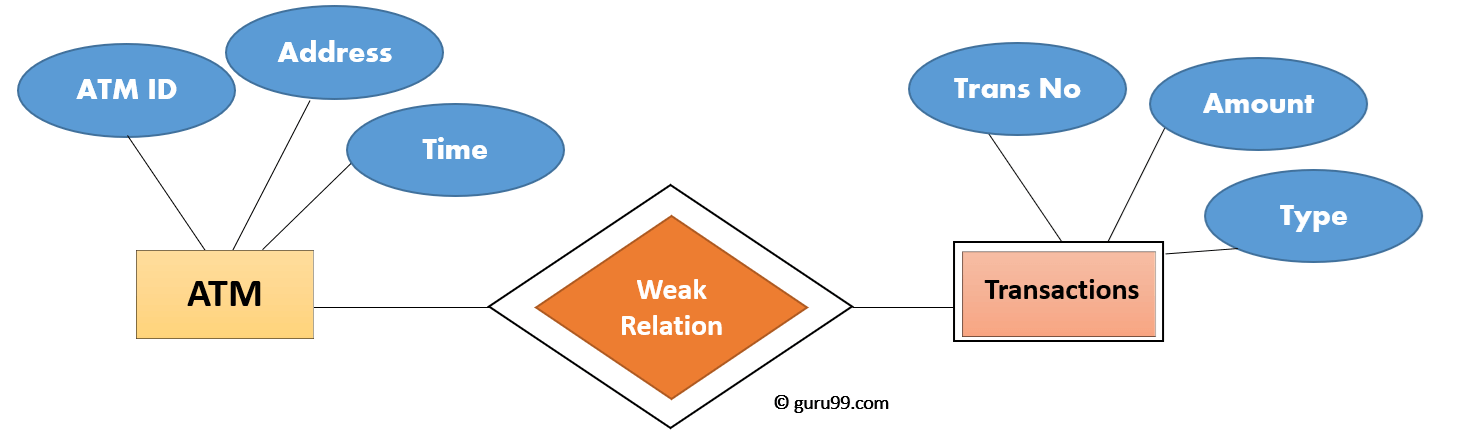
A weak entity lacks a primary key of its own and depends on a strong entity (called the owner entity) for its identification. It uses a partial key (discriminator) combined with the owner’s primary key to achieve uniqueness. For example, in a banking system, a “Transaction” entity depends on an “Account” entity—the transaction number alone isn’t unique across the entire database, but combined with the account number, it becomes unique.
| Strong Entity | Weak Entity |
|---|---|
| Has its own primary key | Does not have a primary key; uses partial key |
| Represented by a single rectangle | Represented by a double rectangle |
| Primary key is underlined with solid line | Partial key is underlined with dashed line |
| Can exist independently | Depends on owner entity for existence |
| Connected with single diamond relationship | Connected with double diamond (identifying relationship) |
| Example: Student, Employee, Product | Example: Transaction, Dependent, Order_Item |
Relationship
A relationship represents an association between two or more entities. Relationships are typically identified using verbs or verb phrases that describe how entities interact with each other. In ER Diagrams, relationships are represented using diamond shapes. Example: Tom works in the Chemistry department.
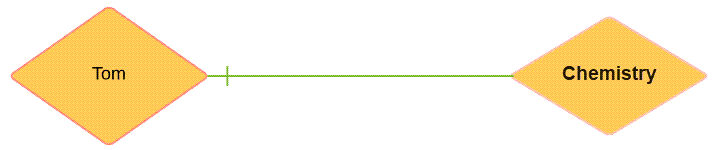
Entities take part in relationships. We can often identify relationships with verbs or verb phrases.
Examples:
- You are attending this lecture
- I am giving the lecture
- A student attends a lecture
- A lecturer is giving a lecture
Attributes
An attribute is a property or characteristic that describes an entity or relationship. Attributes provide the detailed information that makes each entity instance unique and meaningful. In ER Diagrams, attributes are represented using ovals (ellipses) connected to their parent entity by a line.
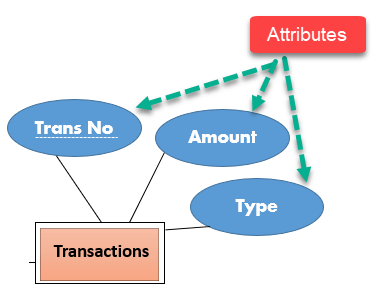
For example, a Student entity might have attributes such as Student_ID, Name, Date_of_Birth, Email, and Phone_Number.
Types of Attributes
| Attribute Type | Description | Example |
|---|---|---|
| Simple (Atomic) | Cannot be divided further into smaller components | Phone Number, SSN, Email |
| Composite | Can be broken down into smaller sub-attributes | Full Name (First, Middle, Last), Address (Street, City, ZIP) |
| Derived | Value is calculated from other attributes; not stored directly | Age (derived from Date of Birth), Total Price |
| Multivalued | Can hold multiple values for a single entity | Phone Numbers, Email Addresses, Skills |
| Key Attribute | Uniquely identifies each entity instance (Primary Key) | Student_ID, Employee_ID, ISBN |
Key Tip: In ER Diagrams, key attributes are shown with their names underlined. Derived attributes are shown in dashed ovals, and multivalued attributes are shown in double ovals.
Cardinality (Relationship Types)
Cardinality defines the numerical constraints of a relationship—specifically, how many instances of one entity can be associated with instances of another entity. Understanding cardinality is essential for designing efficient database structures.
1. One-to-One (1:1)
One entity from set A can be associated with at most one entity from set B, and vice versa.
Example: One student is assigned exactly one student ID, and each student ID belongs to exactly one student.

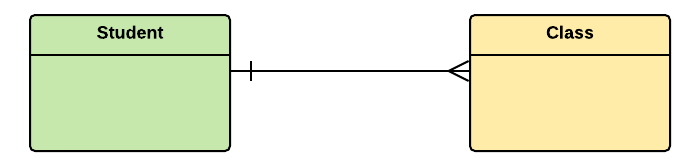
2. One-to-Many (1:N)
One entity from set A can be associated with multiple entities from set B, but each entity in B is associated with only one entity in A.
Example: One class consists of multiple students.

3. Many-to-One (N:1)
Multiple entities from set A can be associated with one entity from set B.
For example, many students belong to the same class.

4. Many-to-Many (M:N)
Multiple entities from set A can be associated with multiple entities from set B, and vice versa.
For example, Students as a group are associated with multiple faculty members, and faculty members can be associated with multiple students.

ER Diagram Symbols and Notations
ER Diagrams use standardized symbols to represent different components. While there are several notation systems, the two most widely used are Chen Notation and Crow’s Foot Notation.
Chen Notation
Chen Notation, developed by Peter Chen in 1976, uses geometric shapes to represent different elements:
| Symbol | Name | Represents |
|---|---|---|
| Rectangle | Entity | Strong entity (e.g., Student, Product) |
| Double Rectangle | Weak Entity | Entity dependent on another (e.g., Transaction) |
| Ellipse/Oval | Attribute | Property of an entity (e.g., Name, ID) |
| Double Ellipse | Multivalued Attribute | Attribute with multiple values (e.g., Phone Numbers) |
| Dashed Ellipse | Derived Attribute | Calculated value (e.g., Age from DOB) |
| Diamond | Relationship | Association between entities (e.g., Enrolls) |
| Double Diamond | Identifying Relationship | Relationship with weak entity |
| Line | Link | Connects components together |
| Underlined Text | Primary Key | Unique identifier for entity |
Crow’s Foot Notation
Crow’s Foot Notation (also called IE Notation) is more commonly used in modern database design tools. It uses different line endings to represent cardinality and is particularly effective for showing the “many” side of relationships.
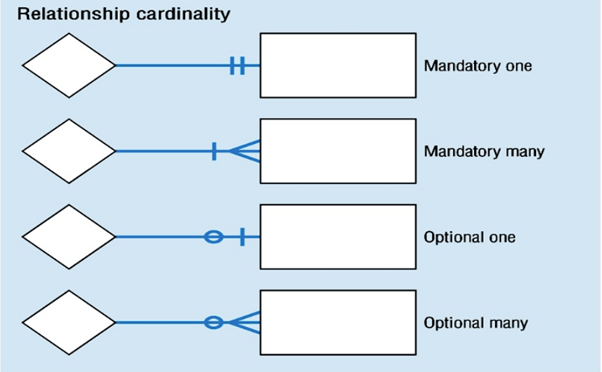
| Symbol Description | Meaning |
|---|---|
| Single vertical line (|) | Mandatory One (exactly one) |
| Circle with line (O|) | Optional One (zero or one) |
| Crow’s foot with line (>|) | Mandatory Many (one or more) |
| Crow’s foot with circle (>O) | Optional Many (zero or more) |
Chen Notation vs. Crow’s Foot: When to Use Each
| Aspect | Chen Notation | Crow’s Foot Notation |
|---|---|---|
| Best For | Conceptual modeling, academic use | Physical/logical modeling, industry use |
| Attribute Display | Shows all attributes visually | Lists attributes inside entity box |
| Cardinality | Uses numbers (1, N, M) | Uses visual symbols |
| Complexity | Can become cluttered | More compact and cleaner |
| Tool Support | Limited modern tool support | Widely supported in tools |
How to Create an Entity Relationship Diagram (ERD)
Now in this ER Diagram (ERD) Tutorial, we will learn how to create an ER Diagram. The following are the steps to create an ER Diagram:

Let’s study them with an Entity Relationship Diagram Example:
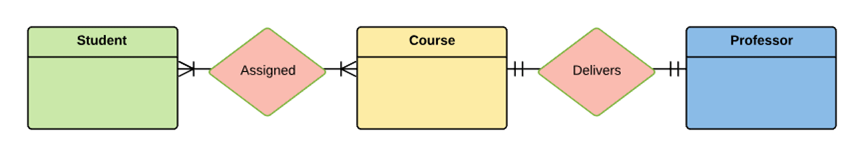
In a university, a Student enrolls in Courses. A student must be assigned to at least one course. A single Professor teaches each course. To maintain instruction quality, a Professor can deliver only one course.
Step 1) Entity Identification
We have three entities:
- Student
- Course
- Professor

Step 2) Relationship Identification
We have the following two relationships:
- The student is assigned a course
- The professor delivers a course

Step 3) Cardinality Identification
From the problem statement, we know that:
- A student can be assigned multiple courses
- A Professor can deliver only one course
Step 4) Identify Attributes
You need to study the files, forms, reports, and data currently maintained by the organization to identify attributes. You can also conduct interviews with various stakeholders to identify entities. Initially, it’s important to identify the attributes without mapping them to a particular entity.
Once you have a list of Attributes, you need to map them to the identified entities. Ensure an attribute is to be paired with exactly one entity. If you think an attribute should belong to more than one entity, use a modifier to make it unique.
Once the mapping is done, identify the primary Keys. If a unique key is not readily available, create one.
| Entity | Primary Key | Attribute |
|---|---|---|
| Student | Student_ID | StudentName |
| Professor | Employee_ID | ProfessorName |
| Course | Course_ID | CourseName |

For Course Entity, attributes could be Duration, Credits, Assignments, etc. For the sake of ease, we have considered just one attribute.
Step 5) Create the ERD
A more modern representation of an Entity Relationship Diagram Example:

Best Practices for Effective ER Diagrams
Follow these guidelines to create clear, maintainable, and effective ER Diagrams:
- Eliminate Redundancy: Remove duplicate entities, attributes, or relationships.
- Use Clear Naming Conventions: Use consistent, descriptive names. Avoid abbreviations.
- Validate Against Requirements: Ensure diagram supports all data storage needs.
- Keep It Simple: Create multiple diagrams at different levels rather than one cluttered diagram.
- Use Color Sparingly: Use colors consistently to highlight categories.
- Document Assumptions: Include notes explaining assumptions about business rules.
- Review with Stakeholders: Have business users and technical team review the diagram.
- Version Control: Maintain versions as the design evolves.
ER Diagrams vs. UML Class Diagrams
While both ER Diagrams and UML Class Diagrams are used for data modeling, they serve different purposes and contexts. Understanding when to use each is important for effective system design.
| Aspect | ER Diagram | UML Class Diagram |
|---|---|---|
| Primary Purpose | Database design | Software/object design |
| Focus | Data and relationships | Objects, methods, and behaviors |
| Methods/Operations | Not supported | Fully supported |
| Inheritance | Limited (in EER only) | Full support |
| Industry Use | Database administrators, data analysts | Software developers, architects |