
What is Data Science? Introduction, Concepts & Process
 Editorial Team
⚡ Smart Summary
Data Science extracts insight from large volumes of structured and unstructured data using statistics, visualization and machine learning. Its six-stage process, core job roles, tool stack and main business applications are set out below.

What is Data Science?
Data Science is the area of study which involves extracting insights from vast amounts of data using various scientific methods, algorithms, and processes. It helps you to discover hidden patterns in the raw data. The term Data Science has emerged because of the evolution of mathematical statistics, data analysis, and big data.
Data Science is an interdisciplinary field that allows you to extract knowledge from structured or unstructured data. Data science enables you to translate a business problem into a research project and then translate it back into a practical solution.


Why Data Science?
Here are significant advantages of using Data Analytics Technology:
- Data is the oil for today’s world. With the right tools, technologies and algorithms, we can use data and convert it into a distinct business advantage
- Data Science can help you to detect fraud using advanced machine learning algorithms
- It helps you to prevent any significant monetary losses
- Allows you to build intelligence into machines
- You can perform sentiment analysis to gauge customer brand loyalty
- It enables you to take better and faster decisions
- It helps you to recommend the right product to the right customer to enhance your business
The timeline below shows how the discipline grew out of statistics and analytics.

Data Science Components
The diagram below summarises the four building blocks.

Statistics
Statistics is the most critical unit of Data Science basics, and it is the method or science of collecting and analyzing numerical data in large quantities to get useful insights.
Visualization
Visualization technique helps you access huge amounts of data in easy to understand and digestible visuals.
Machine Learning
Machine Learning explores the building and study of algorithms that learn to make predictions about unforeseen or future data. It splits broadly into supervised and unsupervised techniques.
Deep Learning
Deep Learning is a machine learning approach in which layered neural networks learn the features themselves, so the algorithm selects the analysis model to follow.
Data Science Process
Now in this Data Science Tutorial, we will learn the Data Science Process. The six stages below run in the order shown:

1. Discovery
Discovery step involves acquiring data from all the identified internal & external sources, which helps you answer the business question.
The data can be:
- Logs from webservers
- Data gathered from social media
- Census datasets
- Data streamed from online sources using APIs
2. Preparation
Data can have many inconsistencies like missing values, blank columns and an incorrect data format, all of which need to be cleaned. You need to process, explore, and condition data before modeling. The cleaner your data, the better your predictions.
3. Model Planning
In this stage, you need to determine the method and technique to draw the relation between input variables. Planning for a model is performed by using different statistical formulas and visualization tools. SQL analysis services, R, and SAS/ACCESS are some of the tools used for this purpose.
4. Model Building
In this step, the actual model building process starts. Here, the data scientist splits the data set into training and testing subsets. Techniques like association, classification, and clustering are applied to the training data set. The model, once prepared, is tested against the “testing” dataset.
5. Operationalize
You deliver the final baselined model with reports, code, and technical documents in this stage. The model is deployed into a real-time production environment after thorough testing.
6. Communicate Results
In this stage, the key findings are communicated to all stakeholders. This helps you decide if the project results are a success or a failure based on the inputs from the model.
Data Science Jobs Roles
Most prominent Data Scientist job titles are:
- Data Scientist
- Data Engineer
- Data Analyst
- Statistician
- Data Architect
- Data Admin
- Business Analyst
- Data/Analytics Manager
Let’s learn what each role entails in detail:
Data Scientist
Role: A Data Scientist is a professional who manages enormous amounts of data to come up with compelling business visions by using various tools, techniques, methodologies, algorithms, etc.
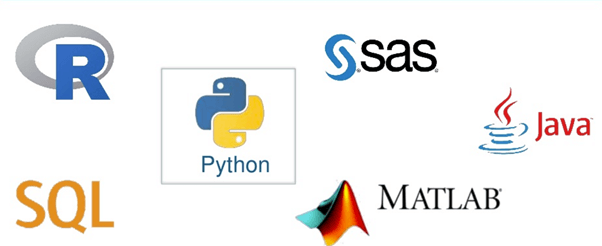
Languages: R, SAS, Python, SQL, Hive, MATLAB, Pig, Spark
Data Engineer
Role: The role of a data engineer is working with large amounts of data. They develop, construct, test, and maintain architectures such as large scale processing systems and databases.
Languages: SQL, Hive, R, SAS, MATLAB, Python, Java, Ruby, C++, and Perl
Data Analyst
Role: A data analyst is responsible for mining vast amounts of data. They will look for relationships, patterns and trends in data. Later they will deliver compelling reporting and visualization for analyzing the data to take the most viable business decisions.
Languages: R, Python, HTML, JS, C, C++, SQL
Statistician
Role: The statistician collects, analyses, and understands qualitative and quantitative data using statistical theories and methods.
Languages: SQL, R, MATLAB, Tableau, Python, Perl, Spark, and Hive
Data Administrator
Role: Data admin should ensure that the database is accessible to all relevant users. They also ensure that it is performing correctly and keep it safe from hacking.
Languages: Ruby on Rails, SQL, Java, C#, and Python
Business Analyst
Role: This professional needs to improve business processes. He/she is an intermediary between the business executive team and the IT department.
Languages: SQL, Tableau, Power BI, and Python
Also, read our Data Science Interview Questions and Answers for practice before an interview.
Tools for Data Science
The tools split into four groups, shown below.
| Data Analysis | Data Warehousing | Data Visualization | Machine Learning |
|---|---|---|---|
| R, Spark, Python and SAS | Hadoop, SQL, Hive | R, Tableau, Raw | Spark, Azure ML Studio, Mahout |
Difference Between Data Science with BI (Business Intelligence)
The table below shows how the two differ.
| Parameters | Business Intelligence | Data Science |
|---|---|---|
| Perception | Looking Backward | Looking Forward |
| Data Sources | Structured data, mostly SQL, and sometimes a data warehouse | Structured and Unstructured data. Like logs, SQL, NoSQL, or text |
| Approach | Statistics & Visualization | Statistics, Machine Learning, and Graph |
| Emphasis | Past & Present | Analysis & Natural Language Processing |
| Tools | Pentaho, Microsoft BI, QlikView | R, TensorFlow |
Also, read the difference between Data Science and Machine Learning.
Applications of Data Science
Some applications of Data Science are:
Internet Search
Google search uses Data science technology to search for a specific result within a fraction of a second.
Recommendation Systems
To create a recommendation system. For example, “suggested friends” on Facebook or “suggested videos” on YouTube, everything is done with the help of Data Science.
Image & Speech Recognition
Speech recognition systems like Siri, Google Assistant, and Alexa run on the Data science technique. Moreover, Facebook recognizes your friend when you upload a photo with them, with the help of Data Science.
Gaming world
EA Sports, Sony, Nintendo are using Data science technology. This enhances your gaming experience. Games are now developed using Machine Learning techniques, and they can update themselves when you move to higher levels.
Online Price Comparison
PriceRunner, Junglee, Shopzilla work on the Data science mechanism. Here, data is fetched from the relevant websites using APIs.
Challenges of Data Science Technology
- A high variety of information & data is required for accurate analysis
- An adequate data science talent pool is not available
- Management does not provide financial support for a data science team
- Unavailability of, or difficult access to, data
- Business decision-makers do not effectively use data science results
- Explaining data science to others is difficult
- Privacy issues
- Lack of a significant domain expert
- If an organization is very small, it cannot have a Data Science team
