9 BEST Wireshark Alternatives for Windows (2026)
Wireshark is a well-known network monitoring and WiFi troubleshooting tool. However, with the Wireshark tool, you can only gather information from the network but not send the collected data. Additionally, its analyzers do not capture the time the packets took to reach their destination, and sometimes, its SPAN port on the switch does not send all the packets to the analyzer.
After dedicating 100+ hours to researching, I have evaluated 40+ Best Wireshark Alternatives for Windows, carefully selecting top options with free and paid versions. My professional and unbiased review offers comprehensive details on their features, pros, cons, and pricing. This well-researched guide may help you find the secret to replacing Wireshark. Be sure to read the entire article to discover these verified and trusted alternatives. Read more…
OpManager’s DPI monitoring simplifies the detection of performance issues and shows whether the issue is on the network or application side. OpManager ensures real-time bandwidth monitoring. It offers in-depth and critical traffic reports to identify issues before they can affect end-users.
Top Alternatives to Wireshark (Mac, Windows, Linux)
| Name | Key Features | Integrations | Platforms | Free Trial | Link |
|---|---|---|---|---|---|
 👍 OpManager |
2000+ metrics, DPI, server monitoring | API, SNMP, Teams | Windows, Linux | 30-Days Free Trial | Learn More |
👍 Site24x7 |
Auto-discovery, multi-vendor support | 450+ integrations | Windows, Mac, Linux and iOS | 30-Days Free Trial | Learn More |
Netflow Analyzer |
NetFlow analysis, bandwidth monitoring | SNMP, NetFlow, sFlow, IPFIX | Windows, Linux | 30-Days Free Trial | Learn More |
PRTG monitor |
Custom maps, real-time alerts | REST, SNMP, MQTT | Windows, macOS, iOS, and Android | 30-Days Free Trial | Learn More |
Deep Packet Inspection |
DPI, NetPath, traffic classification | SolarWinds, SNMP | Windows | 30-Days Free Trial | Learn More |
1) OpManager
OpManager simplifies network management by displaying all infrastructure components on one screen. I found that its DPI monitoring made it possible to quickly detect and resolve performance issues. It helps you see whether a problem is due to the network or the application, saving time. I particularly liked how it provides clarity in troubleshooting.
Its DPI-based bandwidth monitoring presents source, destination, and application data. This lets you identify top bandwidth-consuming applications. OpManager’s capabilities as a bandwidth monitoring tool can be strengthened with the addition of Netflow Analyzer.
Supported Platform: Windows,Linux, iOS, and Android
Business Size: Small to large businesses
Deployment: On-premise
Free Trial: 30-Days Free Trial
Features:
- Real‑Time Monitoring: This feature lets you view live network metrics and instantly detect unusual activity, such as traffic surges or device outages. Unlike manual packet capturing in Wireshark, it shows broader real-time health indicators. While testing this feature, I noticed you can set refresh intervals as low as 1 minute for highly sensitive environments. This gave us the edge in resolving issues before users even noticed them.
- Network Analysis: OpManager delivers a complete view of your network’s performance with deep insights on latency, bandwidth usage, and error rates. I have used this to troubleshoot an MPLS link issue across two offices, and it helped narrow down the root cause in minutes. You will notice that integrating NetFlow with this feature reveals hidden bandwidth hogs. It’s a lot more scalable than relying solely on Wireshark packet captures.
- Device Auto‑Discovery: This feature scanned our subnet, identified over 200 devices, and neatly categorized them by type without manual tagging. It saved hours of manual entry during a recent office network refresh. The tool lets you schedule these scans to auto-update inventory, which keeps your topology accurate. Compared to Wireshark, it’s plug-and-play and doesn’t require constant packet analysis.
- Network Mapping: OpManager generates intuitive, interactive topology maps that help visualize how devices are connected and where traffic is flowing. I found this especially helpful during a client audit, where I needed to present a clear picture of data routes. Unlike Wireshark’s packet-heavy view, this map gives a cleaner understanding of network dynamics. There is also an option that lets you drag and customize the layout to reflect physical office structure.
- Dashboards & Data Visualization: You get a centralized view of all network metrics in customizable dashboards with drag-and-drop widgets. It was refreshing to break free from raw data dumps and actually see trends like bandwidth usage over time. I suggest setting up separate views for critical systems and branch networks to simplify triage. It brings clarity and helps even non-network folks grasp the state of things quickly.
- Alerts & Notifications: OpManager lets you define thresholds for CPU usage, latency, or disk space and instantly sends alerts via your preferred channel. During a weekend maintenance window, I received an SMS about a downed switch before our NOC even checked the logs. This kind of timely insight simply isn’t possible with Wireshark unless you’re actively capturing traffic. I recommend integrating it with Slack so teams can react collaboratively in real-time.
Pros
Cons
Pricing:
- Price: Request a Quote from Sales.
- Free Trial: 30 Days Free Trial
30-Days Free Trial
2) Site24x7
Site24x7 is a network monitoring solution designed for proactive management. I could access the tools to quickly detect network faults. According to my review, it allows you to keep your network performing at its best, offering a superior choice for those who need fast fault detection.
The NetFlow Analyzer feature enables you to track traffic flows based on technologies like NetFlow, J-Flow, and sFlow. Additionally, the Network Configuration Manager (NCM) feature simplifies device configuration management. You can also discover and monitor Cisco Meraki devices automatically within your Meraki organization with SNMP or REST-API.
Supported Platform: Windows, Linux, iOS, and Android
Business Size: Small to large businesses
Deployment: SaaS-based
Free Trial: 30-Days Free Trial
Features:
- NetFlow traffic analysis: Site24x7 supports multiple flow technologies like NetFlow, sFlow, J-Flow, and AppFlow to monitor real-time traffic patterns. You get clear visibility into top talkers, bandwidth hogs, and application-specific usage. I suggest filtering by protocol when troubleshooting spikes—it helps you isolate non-critical chatter quickly. This is far more scalable than relying on manual packet captures from Wireshark.
- Network Configuration Manager: Automating device backups and detecting unauthorized changes has been a game changer for us. I used it during a firmware audit across mixed Cisco and Juniper gear, and it flagged outdated images I would have missed manually. While using this feature one thing I noticed is it lets you set role-based access for config changes, improving compliance. This goes well beyond Wireshark’s reactive analysis.
- Cisco IPSLA and VoIP monitoring: This feature taps into Cisco IPSLA to give accurate metrics on WAN performance and VoIP call quality. I once used it to diagnose call jitter between two branches and pinpointed the delay to an ISP routing issue. It provides SLA-level metrics that Wireshark doesn’t track in real time. You will notice it even displays MOS scores for VoIP quality, which simplifies SLA verification.
- SDN/SD‑WAN and Meraki support: Site24x7 works well with modern network fabrics like Cisco Meraki, ACI, and VMware SD-WAN. You get device-level and site-level health insights, even for virtual overlays. There is also an option that lets you use APIs for custom integrations, making it easier to correlate app and network data. That helped us during a hybrid WAN rollout.
- IPAM with conflict detection: This feature helps you stay ahead of IP conflicts and misconfigured DNS entries by constantly scanning subnets. I used it during an office expansion where overlapping DHCP scopes could have created downtime. The real-time visibility makes it easy to clean up stale records. I recommend syncing this with your DHCP logs to streamline conflict resolution.
- Environmental sensor monitoring: Site24x7 goes a step further by tracking environmental metrics like temperature, humidity, and voltage. During a recent server room incident, it helped me detect a failed cooling unit before hardware was affected. It connects digital and physical monitoring through a single pane. The tool lets you set sensor-specific thresholds, so alerts only trigger when truly needed.
Pros
Cons
Pricing:
- Price: Plans start at $9 per month When paid annually.
- Free Trial: 30 Days free trial (No credit card required)
30-Days free trial (No credit card required)
3) Netflow Analyzer
Netflow Analyzer provides comprehensive network traffic analysis by leveraging flow-based monitoring technologies. I particularly appreciated the real-time bandwidth monitoring that made it possible to identify traffic patterns and bandwidth consumption instantly. It helps you gain deep visibility into network usage, and in my experience, it is one of the best tools for flow-based network analysis and security monitoring.
Supported Platform: Windows, Linux
Business Size: Small to Large Enterprises
Deployment: Cloud-hosted & On-premise
Free Trial: 30-Days Free Trial
Features:
- Multi‑protocol flow support: Netflow Analyzer supports NetFlow, sFlow, J-Flow, IPFIX, and other flow technologies to provide comprehensive traffic visibility. You can monitor bandwidth usage, top talkers, and application traffic across diverse network infrastructures. I have used this to analyze traffic patterns during peak hours and identify bandwidth bottlenecks. I recommend configuring multiple flow sources for complete network coverage and better anomaly detection.
- Real‑time traffic analysis: With instant traffic monitoring, Netflow Analyzer provides real-time insights into network performance and security threats. I configured real-time alerts for unusual traffic spikes during a DDoS attack simulation. You will notice that real-time dashboards help identify security incidents as they happen. This proactive approach easily outpaces Wireshark’s reactive packet analysis in enterprise environments.
- Advanced security analytics: The tool automatically detects security threats like DDoS attacks, port scans, and data exfiltration attempts through flow analysis. I once used it to identify a compromised endpoint that was communicating with suspicious external IPs. It provides security insights that traditional packet capture tools miss. The tool lets you set custom security policies and receive instant alerts when violations occur.
- Bandwidth utilization monitoring: Netflow Analyzer tracks bandwidth consumption by applications, users, and protocols, helping optimize network performance. I used this to identify non-business applications consuming excessive bandwidth during work hours. It eliminates the need for continuous packet sniffing. While testing this feature, I found that historical bandwidth reports revealed hidden usage patterns and trends.
- Application‑aware monitoring: The solution provides deep visibility into application performance and usage patterns through intelligent flow analysis. I have monitored cloud applications and SaaS traffic to ensure optimal user experience. It seamlessly integrates through flow data collection from routers and switches. There is also an option that lets you create custom application groups for better traffic categorization and reporting.
- Forensic analysis capabilities: Netflow Analyzer offers detailed forensic analysis with historical flow data storage and advanced search capabilities. I started with basic traffic analysis and expanded to security incident investigation. Flow-based monitoring provides better scalability compared to full packet capture. I suggest using flow data retention policies to balance storage costs with investigation requirements effectively.
Pros
Cons
Pricing:
- Price: Request a Quote from Sales
- Free Trial: 30 Days Free Trial
30-Days Free Trial
4) PRTG monitor
PRTG monitor provides a complete view of your IT infrastructure by tracking systems, devices, traffic, and applications. I particularly appreciated the distributed monitoring that made it possible to oversee networks in different locations. It helps you keep control of its on-premises installation, and in my experience, it is one of the best tools for flexible and scalable monitoring.
Supported Platform: Windows, macOS, iOS, and Android
Business Size: Small to large businesses
Deployment: On-premises, Cloud
Free Trial: 30-Days Free Trial
Features:
- Multi‑interface dashboards: PRTG’s drag-and-drop dashboards let you build real-time views of your network’s performance. You can track top talkers, bandwidth usage, and device health in a single pane. I have used this to provide exec-level visibility during high-traffic events. I recommend using custom maps for different departments to simplify issue tracking across teams.
- Sensor‑based monitoring: With over 200 sensor types, PRTG supports deep insights into everything from SNMP and WMI to REST APIs and IP traffic. I configured sensors for both bandwidth usage and SQL server health during a database migration. You will notice that combining REST and SNMP sensors helps bridge app-level and network-level insights. This flexibility easily outpaces Wireshark in scale.
- Alerts & notification system: You can define thresholds for any sensor, and alerts trigger instantly through email, SMS, or even webhooks. I once set up an HTTP callback to auto-scale AWS resources when CPU load exceeded limits. This made the system self-healing to a degree. The tool lets you configure notification delays to avoid alert storms during routine maintenance.
- Packet & flow analysis: PRTG supports both packet sniffing and NetFlow-based monitoring, making it ideal for identifying protocol misuse or bandwidth abuse. I used this to trace unexpected streaming traffic from a BYOD device during a network slowdown. It eliminates the need for hands-on packet filtering. While testing this feature, I found that combining flow data with QoS tagging revealed hidden application bottlenecks.
- Vendor‑agnostic monitoring: PRTG works across mixed environments—whether it’s Windows servers, Linux appliances, or cloud VMs. It seamlessly integrates through SNMP, SSH, WMI, or API calls. I have monitored hybrid setups with it where tools like Wireshark fell short in coverage. There is also an option that lets you auto-discover devices regardless of vendor, which simplifies deployment.
- Transparent licensing & free edition: PRTG offers up to 100 sensors for free with no time limit, which is generous for small teams or labs. I started with the free version during a pilot rollout and upgraded only after scaling. Sensor-based pricing also avoids surprises on billing. I suggest using sensor groups to stay under the limit and still monitor key services effectively.
Pros
Cons
Pricing:
- Price: Starts at $179 paid annually
- Free Trial: Download for free
Download for free
5) Deep Packet Inspection
Deep Packet Inspection by SolarWinds provides a great option for network monitoring by quickly discovering devices and deploying them within an hour. I checked its ability to customize performance dashboards and views, and it was very helpful. It also detects slowdowns to prevent them from affecting end-users, making it one of the best choices for network stability.
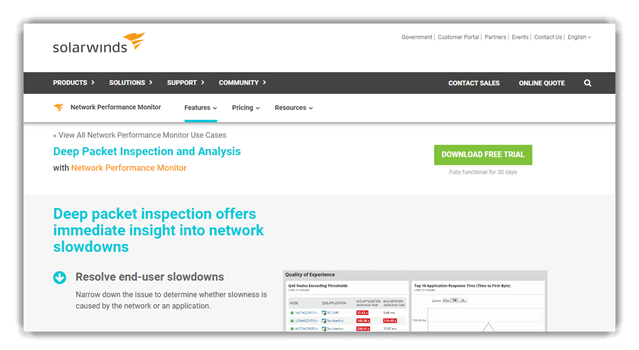
Features:
- Automated traffic classification: Deep Packet Inspection automatically sorts network traffic by protocol, risk, IP usage, and volume. This makes it easier to spot unauthorized apps or non-business traffic that might bypass basic firewalls. I suggest combining this with policy-based controls to actively block categories like peer-to-peer or shadow IT usage. It works faster than manual deep dives in Wireshark.
- Quality of Experience dashboard: This visual dashboard translates packet data into real-world user experience insights. It shows how apps actually perform, based on jitter, response time, and packet loss. I used it to troubleshoot Office 365 slowness and quickly linked the issue to a DNS misconfiguration. You will notice it surfaces poor user experience even when system metrics look normal.
- Configurable DPI alerts: Administrators can define custom thresholds for packet-level indicators like retransmits, latency, or protocol anomalies. I once configured alerts to flag abnormal TLS handshake times and caught a certificate renewal failure before it caused outages. The tool doesn’t wait for users to report problems—it sees them first. There is also an option that lets you suppress alerts during scheduled downtime, reducing false positives.
- Low‑overhead packet metadata capture: Unlike full packet captures, this feature focuses on metadata—keeping resource use low without losing analytical depth. I have deployed this on mirrored ports in production and saw less than 5% CPU usage. It’s a leaner alternative to Wireshark for long-term monitoring. While using this feature one thing I noticed is it stores just enough context to investigate without compliance concerns over payloads.
- PerfStack correlation: This feature overlays DPI metrics with performance counters in a single timeline. I used it during a Citrix issue to connect app slowdowns with increased TCP retransmissions. That correlation narrowed the root cause to a backend switch port. I recommend bookmarking saved PerfStack views for recurring issues—they serve as baseline references.
- Hop‑by‑hop path visualization: NetPath gives you a visual map of how packets travel across the network. It traces latency, loss, and DNS resolution at every node. I relied on this when diagnosing intermittent access delays across a multi-site VPN. The tool lets you hover over each hop to view historical performance, which helped spot random ISP-side slowdowns.
Pros
Cons
Pricing:
- Price: Request a Quote from Sales.
- Free Trial: 30 Days Free Trial
Download link: https://www.solarwinds.com/network-performance-monitor/use-cases/
6) CloudShark
CloudShark offers a web-based platform for analyzing network traffic. I tested its packet capture capabilities, and it helped me solve network issues faster. The tool made it easy to drag and drop captures into my browser. In my experience, its advanced features boosted team efficiency, while it also lowered operational costs.

Features:
- Web-based Wireshark interface: CloudShark brings the Wireshark interface to your browser, eliminating the need for local installs. It’s especially helpful for teams that need shared access to packet captures without worrying about OS compatibility. I recommend using role-based access controls to manage who can view, comment, or annotate captures. This makes it easier to coordinate in larger environments.
- Integrated Suricata alerts: You can visualize Suricata IDS alerts right inside packet captures, making threat detection more actionable. I used this to investigate a brute-force SSH scan and jumped straight to suspicious packets without delay. The tool lets you sort alerts by severity or source IP to speed up triage. It blends threat intelligence directly into your packet workflow.
- Zeek log correlation: This feature allows you to compare Zeek logs with packet-level data, which gives strong context during investigations. I have relied on this to trace a suspected data exfiltration case. The high-level summaries from Zeek made it easier to spot anomalies, while the packet data confirmed details. While using this feature one thing I noticed is you can pivot from a Zeek log directly into the corresponding PCAP view.
- Advanced analysis toolkit: From VoIP call flows to SSL decryption and DNS lookups, CloudShark offers powerful in-browser tools that eliminate the need for external plugins. I tested the RTP playback tool during a VoIP quality audit and pinpointed audio dropouts with ease. You will notice it renders SIP ladder diagrams automatically, which is a huge time-saver when validating call setups.
- DeepSearch across captures: CloudShark’s DeepSearch scans multiple PCAPs at once, using Wireshark-style display filters to track down specific patterns. I once used it to locate traffic matching an old malware C2 signature buried in weeks of archive data. It delivered results in seconds. I suggest tagging captures by incident or date to make multi-file search even more efficient.
- Containerized or on‑prem deployment: You can run CloudShark in Docker or on a local server, giving you full control over sensitive packet data. I helped deploy it on-prem for a finance client with strict compliance needs, and it scaled well without internet access. There is also an option that lets you integrate LDAP for user authentication, which improves enterprise readiness.
Pros
Cons
Pricing:
- Price: Its starting price is $4,200 annually
- Free Trial: Request a demo
Download link: https://cloudshark.io/
7) Debookee
Debookee is a top-rated tool I checked for network monitoring. I could intercept and watch traffic from devices on the same subnet with ease. It allowed me to capture data from my printer and mobile devices on Mac without needing any proxy. I found that the one-click interception is one of the top features, and it causes no network disturbance, which makes it an ideal choice for monitoring.

Features:
- LanScan subnet discovery: Debookee’s LanScan scans your network using multiple methods like ARP, ICMP, and SMB to reveal devices with MAC addresses and hostnames. I have used this during live audits to identify rogue devices on guest Wi-Fi. While testing this feature, I noticed it highlights gateways and lets you directly select targets for packet capture. That saved me a lot of filtering effort compared to Wireshark.
- HTTP/DNS/TCP protocol parsing: This feature automatically extracts key communication exchanges, like HTTP requests or DNS queries, in human-readable format. It helped me quickly debug a broken API call without wading through packet hex. I recommend filtering by domain name or HTTP method—it makes troubleshooting more focused and less noisy. This speeds up the workflow dramatically.
- VoIP (SIP/RTP) monitoring: Debookee recognizes and logs VoIP call details including SIP headers and RTP metrics in real time. I used it to troubleshoot choppy audio in a VoIP deployment and found that dropped RTP packets were the root cause. It’s especially handy since it works with both wired and wireless traffic. You will notice it also shows jitter values during active calls, which helps detect poor call quality early.
- SSL/TLS decryption: Debookee can intercept and decrypt SSL traffic from HTTPS, IMAPs, and other secure protocols with a single toggle. I have used this to debug authentication errors in OAuth workflows on mobile apps. The tool lets you install a certificate on the target device to decrypt without breaking sessions—something Wireshark doesn’t do natively. It’s a huge advantage for app developers.
- Wi‑Fi radio monitoring: This feature captures 802.11 traffic in monitor mode, showing access points, retry rates, and FCS errors. I used it to diagnose unstable Wi-Fi at a co-working space and found excessive retries from one AP. The real-time error stats made root cause clear. There is also an option that lets you sort by signal strength, making weak-link detection easier.
- Live scan updates: Debookee dynamically updates its device list as new hosts appear or disconnect during a scan. I found this especially useful when tracking down intermittent DHCP conflicts. Unlike static captures, it reflects changes as they happen. I suggest keeping the LanScan tab open during audits—it gives you constant awareness of your network’s moving parts.
Pros
Cons
Pricing:
- Price: Plan starts at $39.90.
- Free Trial: Free Download
Download link: https://debookee.com/
8) Omnipeek
Omnipeek is the best tool for network analytics and performance. I personally recommend it for finding network issues quickly. It is one of the easiest ways to scan packets for trouble and to see changes in transfer speed. The tool also helps you compare problems and reduce MTTR, which is great for effective network management. Plus, it automates multi-step analysis, making it ideal for both encrypted and open traffic checks.

Features:
- Real‑time packet intelligence: Omnipeek gives immediate feedback on traffic flows, packet details, and metadata, making troubleshooting much faster than sifting through captures manually. I used this to diagnose a file transfer issue and spotted retransmits instantly. The tool lets you correlate flow charts with raw packet views, which shortens the investigation time. This makes it more efficient than Wireshark in high-volume environments.
- Support for wired, wireless, VoIP, video: Whether you’re working with high-speed Ethernet or wireless 802.11 traffic, Omnipeek handles it. I tested VoIP and video capture during a remote meeting and the call quality breakdown—including jitter and packet loss—was spot on. It supports playback of RTP streams too. You will notice it summarizes multimedia metrics, which helps in capacity planning and QoS checks.
- Expert‐analysis engine: Omnipeek automatically flags anomalies like excessive retransmissions, DHCP conflicts, and DNS failures. This real-time alerting saved us during a major rollout when it caught duplicate IP assignments before users were affected. While using this feature one thing I noticed is you can define custom policies that trigger alerts, giving more control than Wireshark’s passive analysis. It’s like having a built-in network analyst.
- Multi‑segment and remote capture: You can deploy capture engines across multiple locations—branch, data center, or cloud—and manage them all from one console. I once connected to remote sites across a WAN link to troubleshoot latency issues without flying out. It gave us full packet visibility from any segment. I recommend tagging each capture engine by role or location—it makes switching views much easier.
- Wireless multi‑channel capture: With a supported USB WiFi adapter, Omnipeek can capture traffic on multiple channels at once. I used this during a BYOD audit and spotted interference across several SSIDs. It helps you avoid blind spots when analyzing mobile issues. There is also an option that lets you visualize retry rates per channel, helping pinpoint poor RF performance.
- Flow‑based visualization dashboards: Omnipeek’s dashboards include Application views, Peer Maps, Voice/Video stats, and Compass flow graphs. These give a structured view of how data moves across the network. I have used the Peer Map to reveal unauthorized east-west traffic between servers. I suggest customizing dashboards per role—for example, voice teams can focus on jitter and MOS scores. This makes analysis more role-specific and actionable.
Pros
Cons
Pricing:
- Price: Request a Quote from Sales.
- Free Trial: 15 Days Free Trial
Download link: https://www.liveaction.com/products/omnipeek/
9) Ettercap
Ettercap is a powerful network monitor tool. During my research, I found that it supports both active and passive checks of different network protocols. It is great for network analysis as it helps me check both hosts and overall network health. I also noticed that it is open-source, which allowed me to report bugs and join the community.

Features:
- Live connection sniffing: Ettercap captures live network traffic by placing your network interface in promiscuous mode or using ARP poisoning. I have used it to inspect both encrypted and plain-text protocols across a local LAN without relying on mirrored ports. While testing this feature, one thing I noticed is you can apply filters to isolate specific services like Telnet or FTP. This reduces noise and accelerates targeted analysis.
- ARP poisoning MITM: This feature allows you to act as a man-in-the-middle by spoofing ARP replies between two hosts. It’s highly effective for studying endpoint communication without disrupting services. I have used this during lab exercises to inspect DNS requests in real time. I suggest enabling IP forwarding to avoid breaking connections during MITM inspection.
- Multi-mode sniffing: Ettercap gives you four sniffing modes—IP-based, MAC-based, ARP full duplex, and PublicARP half duplex. Each mode suits different network conditions, which is useful if switch mirroring isn’t available. The tool lets you switch modes on the fly, which helped me adjust quickly when analyzing segmented VLAN traffic. Compared to Wireshark, this offers more tactical flexibility.
- Protocol dissection: Ettercap dissects a wide range of protocols live, even parsing metadata from encrypted sessions like SSH1 and HTTPS. I once used this to identify SSL handshakes in an outdated encryption setup. The level of insight is deeper than standard sniffers. You will notice it organizes extracted metadata by service type, which simplifies cross-session tracking.
- Character injection: Ettercap can inject characters directly into active TCP streams, allowing real-time manipulation of sessions. I tested this in a closed environment to simulate tampering with HTTP headers. It gave us visibility into how a client-server app responded to modified commands. There is also an option that lets you simulate slowloris-style attacks by delaying packet flow.
- Packet filtering and manipulation: With powerful on-the-fly packet filtering, Ettercap can drop, alter, or replace data midstream. I have used it to substitute text inside unencrypted payloads during testing. I recommend setting strict rules with payload size checks to avoid crashing target applications. This level of manipulation makes it ideal for deep protocol experiments or red team assessments.
Pros
Cons
Pricing:
- Price: Free Download
Download link: https://www.ettercap-project.org/downloads.html
What is Wireshark?
Wireshark is a popular, open-source network analyzer widely used for monitoring and troubleshooting network traffic. It’s like a magnifying glass that allows network administrators to view data packets as they travel through a network. With Wireshark, you can quickly pinpoint network issues such as latency, packet loss, and security vulnerabilities. What makes Wireshark particularly useful is its intuitive graphical interface, making it suitable even for beginners in network analysis.
Over my years in network administration, Wireshark has consistently proven itself reliable for analyzing network protocols, capturing real-time data, and exporting detailed reports. However, Wireshark isn’t perfect for everyone. It may be overwhelming due to its extensive features, and some users prefer simpler tools or software optimized for Windows environments.
- Main Features: Live network capture, detailed packet analysis, protocol decoding, filtering options, and comprehensive data visualization.
- Use Cases: Identifying network issues, analyzing performance problems, and monitoring security breaches.
- Limitation: Steep learning curve for novices, potentially excessive detail for basic troubleshooting tasks.
How Did We Choose BEST Wireshark Alternatives?

At Guru99, we are committed to providing accurate, relevant, and objective information. Our thorough content creation and review process ensures reliable resources for your needs. After dedicating 100+ hours to researching, I evaluated over 40 of the best Wireshark alternatives for Windows, including both free and paid versions. This comprehensive, unbiased review covers key features, pros, cons, and pricing. Finding the best Wireshark alternatives requires a careful analysis of features and compatibility, aiming to deliver efficient network monitoring solutions.
- Real-Time Monitoring: Network monitoring tools should provide real-time performance monitoring and visualization.
- Training Costs: The cost involved in training employees on the tool is important to consider.
- Customizable Roles: Tools should be customizable to match each user’s specific roles effectively.
- Security Options: It is important to assess the security options offered by software providers.
- Product Price: Ensure that the product price aligns with your budget while offering valuable features.
- Feature Match: Ensure the product features meet your specific requirements.
- Software Integration: Integration with management software such as ERP is desirable for smooth operations.
- Best Fit: There is no one-size-fits-all tool; select one that best caters to your unique needs.
Verdict
Over the years, I have explored many network monitoring tools, and I believe Wireshark is a great choice for packet analysis. However, its limitations in capturing packet time and analyzing data prompted me to seek alternatives that offer more comprehensive solutions. If you are looking for a secure, robust, and customizable alternative to Wireshark, check my verdict below.
- OpManager: This tool stands out with its real-time monitoring, making it a top-notch choice for bandwidth analysis. I recommend it for its comprehensive network insights and problem-identification features.
- Site24x7: With impressive multi-vendor support and seamless integration, Site24x7 is the ideal option for businesses of all sizes. Its automatic discovery feature and lightweight nature make it an excellent solution for managing network performance issues.
- Netflow Analyzer: It provides comprehensive network traffic analysis by leveraging flow-based monitoring technologies. It is one of the best tools for flow-based network analysis and security monitoring.
FAQs
OpManager’s DPI monitoring simplifies the detection of performance issues and shows whether the issue is on the network or application side. OpManager ensures real-time bandwidth monitoring. It offers in-depth and critical traffic reports to identify issues before they can affect end-users.