SAP BW Characteristics & Key Figures
⚡ Smart Summary
Characteristics and key figures in SAP BW define the structure of every query, where characteristics describe business dimensions and key figures hold the measurable values that formulas, calculated key figures, and restricted key figures refine for reporting.

What Are Characteristics and Key Figures in SAP BW?
In SAP BW, a query is built from characteristics and key figures. Characteristics describe the business dimensions of the data, such as customer, product, or fiscal period. Key figures hold the measurable values, such as revenue, quantity, or cost.
The settings below control how characteristics and key figures are displayed and calculated, and how formulas, calculated key figures, and restricted key figures refine the results.
Characteristics Settings – Display Name
By default, when a characteristic is added to the query, it displays the description specified in SAP BW. It is possible to replace this with customized text as follows:
- Click on Properties.
- Select the General tab.
- Enter the Description.

Characteristics Settings – Display Properties
- Select the Display tab of the properties window of the selected characteristic.
- The “Display as” option is used to display either only the Key, only the Text, or both Key and Text.
- If a characteristic has two or more of Short / Medium / Long Text populated, “Text View” is used to display the corresponding text.
- It is possible to sort data ascending or descending either by the characteristic or any of its attributes.
- The “Result Rows” option is used to show or hide the sub-total for the underlying characteristic.

Characteristics Settings – Display Records
The display option is used to define what data is viewed by the user during data selection (in filters) and after report execution.
- Select the Advanced tab of the properties window of the selected characteristic.
- Access Type for Result Values. Choose one of these values.
- “Posted values” shows only records that have some transactions associated with them.
- “Master Data” displays all master data records irrespective of whether a transaction exists for them. It is ineffective if used with zero suppression.
- Filter Value Selection. Choose one of these values.
- Only Posted Values for Navigation: the system displays only posted values from the current navigational state.
- Only Values in InfoProvider: the system displays only values contained in the InfoProvider.
- Values in Master Data Table: faster, but may result in zero records matching the selection criteria.

Key Figure Settings – Display Name
By default, when a Key Figure is added to the query, it displays the description specified in SAP BW. It is possible to replace this with customized text as follows:
- Click on Properties.
- Select the General tab.
- Enter the Description.

Key Figure Settings – Display Properties
- Select the Display tab of the properties window of the selected Key Figure.
- Hide:
- The options “Always Show” and “Always Hide” are self-explanatory.
- “Hide (Can be Shown)” keeps a key figure hidden in the default output, but the user can later display it using filters.
- Number of Decimal places can be used to restrict the decimals displayed in the report.
- Scaling factor is used to show data in thousands, hundreds, and so on.
- The sign of key figures can be reversed if required. For example, Sales Quantity is a negative movement from the inventory perspective but positive from the sales perspective.

Key Figure Settings – Currency Or Unit Conversion
BW does not allow cumulating amounts in different units, for example one rupee to one dollar or one kilogram to one yard. When data exists in multiple currencies or units, all records must be converted to a single currency or unit using Currency Translation or Unit Conversion. The translation can be dynamic (using a selection screen variable) or static (with the target currency or unit hardcoded). The advantage of doing this in SAP BW is that it directly imports the conversion factors available in SAP ERP.
- Select the Conversions tab.
- For currency translation, this option can be used.
- For unit conversion, this option can be used.

Key Figure Settings – Aggregation
Query Designer gives the flexibility of calculating aggregates such as average, summation, and minimum. Similar calculations can also be performed on row-level data.
- Select the Calculations tab.
- Select from the different options available under the drop-down of “Calculate Results As”.

Key Figures – Local Formula
BW allows the use of formulas on data coming from the InfoProvider to provide calculated values to the user, for example subtracting Cost from Revenue to calculate Profit.
Steps to Create a Formula
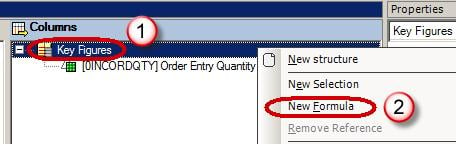
Step 1)
- Right click on the structure “Key Figure”.
- Click on “New Formula”.
Step 2) Click on the edit button of the properties box to create or edit a local formula.

Step 3) Some of the common operators used in BW include:
- Addition, Subtraction, Multiplication, and Division.
- NODIM displays key figures without their corresponding unit.
- NOERR displays zero instead of an error message, for example zero instead of a division-by-zero error.
- %GT shows the value of a key figure as a percentage of the total value.
- In the “Detail View” box, enter the formula.
- Use the operators from the “Operators” box.

Key Figures – Calculated Key Figure
If the same calculation is required for multiple reports, it can be mapped to the InfoProvider instead of being created individually in each query. Such a key figure is called a “Calculated Key Figure” or CKF.
Once defined, it can be dragged into a query like any other key figure. The biggest advantage of this approach is that it enables global definitions of common calculated KPIs.
Steps to create a Calculated Key Figure:
- Navigate to the InfoProvider section.
- Right click on the Key Figures folder.
- Choose the option “New Calculated Key Figure”.

Key Figures – Restricted Key Figure
Restricted Key Figures (RKF) can be used to selectively apply filters to a specific KPI in the report, but not to the entire report, for example splitting sales into columns such as YTD (Year To Date) Sales and PYTD (Previous Year To Date) Sales.
Step 1)
- Navigate to the InfoProvider section.
- Right click on the Key Figures folder.
- Choose the option “New Restricted Key Figure”.

Step 2) Click on the edit button of the properties box to create or edit an RKF.

Step 3) In the subsequent screen, at least one key figure and one characteristic must be entered to make a meaningful RKF.
- The key figure which is to be restricted.
- The characteristic may be restricted by a selection screen variable to make it a “Dynamic” RKF.
- It may also be restricted by a constant, for example year = 2008. In the screenshot, version is restricted with the constant value “1”.

Like CKF, RKFs are also global to the InfoProvider and can be reused in multiple queries using the same InfoProvider.