
Debugger in Informatica: Breakpoint & Verbose Mode
 Editorial Team
⚡ Smart Summary
Debugger in Informatica runs a mapping row by row inside the Designer, so the value held by every port after every transformation becomes visible instead of only the final result written to the target.
As we discussed in previous topics, a mapping is a collection of source and target objects linked together by a set of transformations. These transformations consist of a set of rules, which define the data flow and how the data is loaded into the targets.
What is Debugger?
Debugger is a very handy utility in Informatica. When we execute the mapping, Informatica executes the mapping based on the transformation logic defined.
Its execution is similar to batch mode execution, where we cannot see the intermediate results or how the data is modified from transformation to transformation.
Many times the data we get in the target is not what we expected. With the help of the Debugger, we can analyze how the data moves within the mapping, row by row.
The Debugger requires a session instance. We can either reuse an existing session created earlier to run the mapping, or create a new debug session instance. Because the data is fetched from the source during debugging, we choose what happens to that data.
- Discard the data, or
- Load the data into the target
These options can be set during the configuration of the Debugger.
To monitor the Debugger, there are two windows in the Informatica Designer
- Target window
- Instance window
In the target window, the target record which is going to be inserted into the target table is shown. In the instance window, you can select any of the transformation instances of the mapping. All the ports of that transformation are then visible in this window, so you can analyze how the data is being transformed.
Steps to Use Debugger in a Mapping
The Informatica Designer provides the feature to use the Debugger to debug mappings. It means we can debug and analyze any existing mapping. The requirement for the Debugger is that the mapping should be a valid mapping.
In this exercise, we will debug our existing mapping “m_emp_emp_target” which we created earlier. In our source data, we will check for a particular record of employee_name = ’SCOTT’. For Scott, we will verify the values are fetched in Informatica and whether the record is pushed to the target correctly or not.
Our source data for the “emp” table looks like this.

For the ename “SCOTT”, using the Debugger we will check what value for the “sal” (salary) column is fetched in Informatica.
Step 1) Open the Informatica Designer and open the mapping “m_emp_emp_target” by double-clicking on it. It will open the source qualifier and target definition tables showing the mapping inside Mapping Designer.

Step 2) Now start the Debugger
- Click on the Mappings menu option
- Select Debugger from the options
- Select the “Start Debugger” option

Step 3) Select Next on the Debug Mapping window.
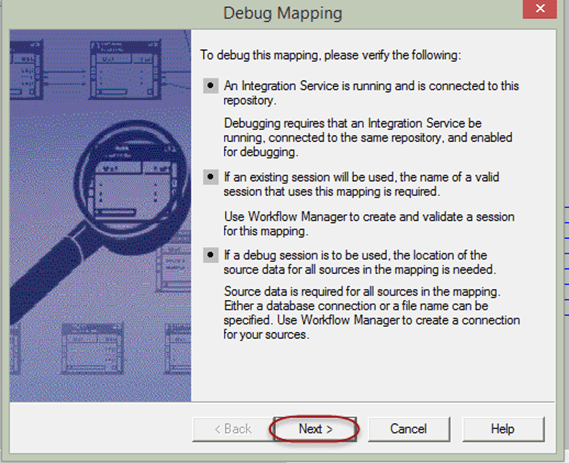
Step 4) In the next window, you will get an option to select the session type. You can use an existing session, an existing reusable session, or you can create a debug session instance.
When you use an existing session, Informatica reuses the session you created earlier for this mapping. When you select create a debug session instance, a new session instance is created for debugging.
In this example, we will select an existing session instance. The Integration Service will be the default.
- Select the “use an existing session instance” option
- Click Next

Step 5) In the new window, Informatica will prompt you to select the existing session for the debugging.
Select the session “s_m_emp_emp_target” and click the Next button.

Step 6) In the next window there will be an option “Discard target data”. We select this option because during debugging we do not want to load any data into our target table.
- Select the option “Discard target data”
- Select the target table “emp_target”
- Click the Finish button

With the above steps, we have configured and started the Debugger. Now we can debug the mapping.
Step 7) The Debugger has started, but it has not fetched any rows from the source. During debugging it fetches data from the source row by row. To fetch the first row from the source
- Select the Mappings option from the menu
- Select the Debugger option
- Select the Next Instance option

Step 8) In the instance window you will see the first fetched record from the source qualifier.

If you analyze the instance window, it will be showing the first record – the ename “SMITH” row. This is not the record we are looking for, so we can move to the next instance.
Step 9) To move to the next row, press the F10 button. This is the shortcut for going to the next instance instead of using the Mappings option and then the Debugger option.
After moving to the next instance, the data in the instance window will change to the next record.
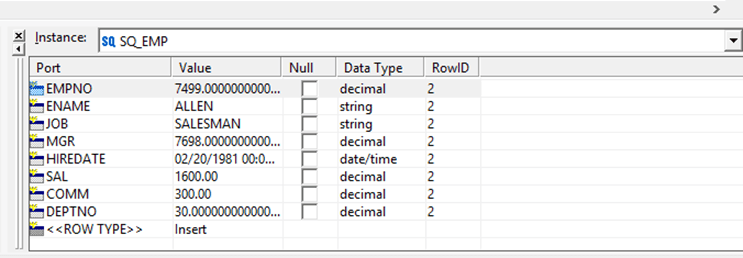
Step 10) Keep pressing the F10 button until you reach the required record of the “SCOTT” employee. Once you reach that point, the instance window will look as shown below.

This is the instance we were looking for. In the instance window we can analyze the data, whether it is coming correctly or any value is missing.
In the source data, the details of the “SCOTT” employee were job = “ANALYST”, manager id = “7566”, sal = “3000”.
And in the Debugger, for the employee “SCOTT” we have analyzed all these details, and they match the source data, so we are assured that the records were fetched correctly by the Source Qualifier.
Using Breakpoint in Debugger
When we are looking for a particular row of data like in the previous example, then instead of going to every instance of source data we can define breakpoints.
A breakpoint is a condition, or a set of conditions, defined during the configuration of debugging such that when that condition becomes true the Debugger halts at that particular instance.
For example, if we define deptno=20 in a breakpoint, then whenever this condition is true for a record, the Debugger will stop at that instance of data.
A breakpoint can also be created against a global condition rather than a single transformation, and its type can be set to error instead of data, which halts the run whenever that transformation raises an error.
Step 1) To configure the breakpoint
- Go to the Mappings menu
- Select the Debugger option
- Select the “Edit Breakpoints” option

Step 2) You will see an “Edit Breakpoints” window as shown below.

Step 3) In the breakpoint window, click on the Add button.

Step 4) In the new window
- Select SQ_EMP as the instance
- Select the OK button

Step 5) The previous window will look as shown below.

Step 6) You have a breakpoint, and now you have to define the breakpoint condition. To define it, click on the “Add New Condition” icon.

A new row under the condition tab will appear. Here we can configure the condition.
Step 7) In the condition table
- In the Port drop-down, select the “ENAME” option, as we are debugging for the record ename=’SCOTT’
- In the value box, enter the value “SCOTT”
- Select the OK button

Step 8) Now start the Debugger as mentioned in the previous topic.
Go to the Mappings menu → select the Debugger option → select Start Debugger → select the session instance.
Step 9) Once the Debugger is started
- Select the Mappings menu
- Select the Debugger option
- Select the Continue option

The Debugger will go to each instance of a row itself and check for the condition “ename=SCOTT”, halting on the record for which the condition is true. So when the data volume is high, a breakpoint lets you jump directly to that record instead of stepping through every source row.

Once Informatica is done going through all the instances, the Debugger stops automatically. If you want to analyze the data again, you have to restart the Debugger.
Tracing in Informatica
Whenever you execute a session for a mapping, a session log is generated. It consists of the details of the execution like
- Timing of the events
- Error details
- Individual transformation statistics, etc.
Inside the transformations of a mapping, you can configure how much detail Informatica writes inside the session log.
There are four levels which can be set for tracing inside the transformations.
| Tracing level | What Informatica writes to the session log |
|---|---|
| Normal | In Normal mode, Informatica writes about the transformation initialization and status information, errors encountered, and summarizes session results. |
| Terse | In Terse mode, Informatica writes only about initialization information and error details. Terse mode writes minimum details into the session log. |
| Verbose Initialization | In Verbose Initialization mode, Informatica writes the log details similar to Normal mode and in addition also writes about the data and index files used and transformation statistics. |
| Verbose Data | In Verbose Data mode, Informatica writes a log similar to Verbose Initialization but in addition also writes every row of data which passes through the transformation. |
Verbose Data also notes where the Integration Service truncates string data to fit the precision of a column.
Note: By default the tracing level is set to Normal. It is recommended to use Verbose Data mode only when you are debugging the mapping. Terse mode can be used to improve performance, as it writes the minimum details, so the overhead of writing the log is minimal.
How to Set Tracing Level in a Transformation
Step 1) Open the mapping in the Informatica Designer for which you want to set the tracing level.

Step 2) Double-click on the transformation, here the Source Qualifier transformation “SQ_EMP”.
It will open the Edit Transformations window.

Step 3) In the Edit Transformations window
- Click the Properties tab
- Select the Tracing Level option
- From the drop-down select Verbose Data
- Select the OK button

Step 4) Save the mapping and execute the mapping. Use the Ctrl+S keyboard shortcut to save the mapping.
Step 5) To view the log
- Open Workflow Monitor and select the session which was executed in the last step
- Click on the “Session Log” option to open the session log for the mapping

This will open the session log window for the mapping.
The session log details how your session executed: the timing for when execution started and stopped, a basic idea of performance, which database connection and parameter file were used, and how many source records were fetched and how many were loaded into the target.

Step 6) Scroll down in the log, and you can see additional log details captured, including the data records.

In this way, you can set the tracing level in mappings to capture the additional details for debugging.
In this tutorial, you have learned how to set, configure and execute the Debugger and how to set the tracing level in mappings. These options provide you the ability to debug the mappings.
