
Workflow Monitor in Informatica: Gantt Chart & Tasks
 Editorial Team
⚡ Smart Summary
Workflow Monitor in Informatica tracks every workflow and task the Integration Service runs, reporting status, start and completion times, row counts and logs through two complementary layouts, the Task view and the Gantt Chart view.
In our previous tutorial, we discussed the workflow – which is nothing but a group of commands or instructions to the Integration Service. It defines how to run tasks such as the command task, session task and email task. To confirm that everything is streamlined and executed in the desired order, we need a Workflow Monitor.
What is Workflow Monitor?
Workflow Monitor is a tool with the help of which you can monitor the execution of workflows and the tasks assigned to the workflow. It receives run information continuously from the Integration Service and the Repository Service, and it fetches historic run details from the repository.
In Workflow Monitor you can,
- See the details of execution
- See the history of the workflow execution
- Stop, abort or restart workflows, and tasks
- Display the workflows that have executed at least one time
Workflow Monitor consists of the following windows –
- Navigator window – shows the monitored repositories, folders & Integration Service
- Output window – displays the messages from Integration Services and repository
- Properties window – displays the details/properties about tasks and workflows
- Time window – displays the progress of the running tasks & workflows with timing details.
The screenshot below shows the four windows arranged in a single Workflow Monitor session.

Now, let us see what we can do in Workflow Monitor.
How to Open Workflow Monitor
Step 1) In the Informatica Designer or Workflow Manager toolbar, click on the Workflow Monitor icon.

Step 2) This will open the Workflow Monitor window.
In the Workflow Monitor tool, you will see the repositories and associated Integration Services on the left side. Under the status column, you will see whether you are connected or disconnected to the Integration Service. If you are in the disconnected mode, you will not see any running workflows. There is a time bar which helps us to determine how long it took a task to execute.

Step 3) The Workflow Monitor is in a disconnected mode by default. To connect to the Integration Service.
- Right-click on the Integration Service
- Select the connect option

After connecting, the monitor will show the status as connected.

Views in Workflow Monitor
There are two types of views available in the Informatica Workflow Monitor.
- Task view
- Gantt Chart view
Both views read the same run data, so the choice depends on the question being asked.
| View | Layout | Best used for |
|---|---|---|
| Task view | Report format, organised by workflow run | Comparing and filtering many runs |
| Gantt Chart view | Chronological bars along a time axis | Seeing duration and overlap of tasks |
Task View
Task view displays the workflow runs in report format, and it is organized by workflow runs. It provides a convenient approach to compare workflow runs and filter details of workflow runs.
Task view shows the following details
- Workflow run list – Shows the list of workflow runs. It contains folder, workflow, worklet, and task names. It displays workflow runs in chronological order with the most recent run at the top. It displays folders and Integration Services alphabetically.
- Status message – Message from the Integration Service regarding the status of the task or workflow.
- Node – Node of the Integration Service executed the task.
- Start time – The time at which task or workflow started.
- Completion time – The time at which task or workflow completed the execution.
- Status – Shows status of the task or workflow, whether the workflow started, succeeded, failed or aborted.
Each of those columns is visible in the report grid shown below.

Gantt Chart View
In Gantt chart view, you can view a chronological view of the workflow runs. The Gantt chart displays the following information.
- Task name – Name of the task in the workflow
- Duration – The time taken to execute the task
- Status – The most recent status of the task or workflow
How to Switch Between Gantt Chart and Task Views
To switch from Gantt chart to Task view or vice versa, click on the respective button as shown in the screenshot to change the mode.

Example: How to Monitor and View Details
In previous examples, we have created a
- Mapping “m_emp_emp_target”: A mapping is a set of instructions on how to modify the data and processing of transformations that affects the record set.
- Session “s_m_emp_emp_target”: A session is a higher level object to a mapping which specifies the properties of execution. For example, performance tuning options, connection details of sources/targets, etc.
- Workflow “wkf_s_m_emp_emp_target”: A workflow is a container for the session and other objects, and it defines the timing of the execution of tasks and the dependency or flow of execution.
Now, we will analyze the details of execution in this topic.
Step 1) Restart the workflow from the Workflow Designer, as described in the previous topic.

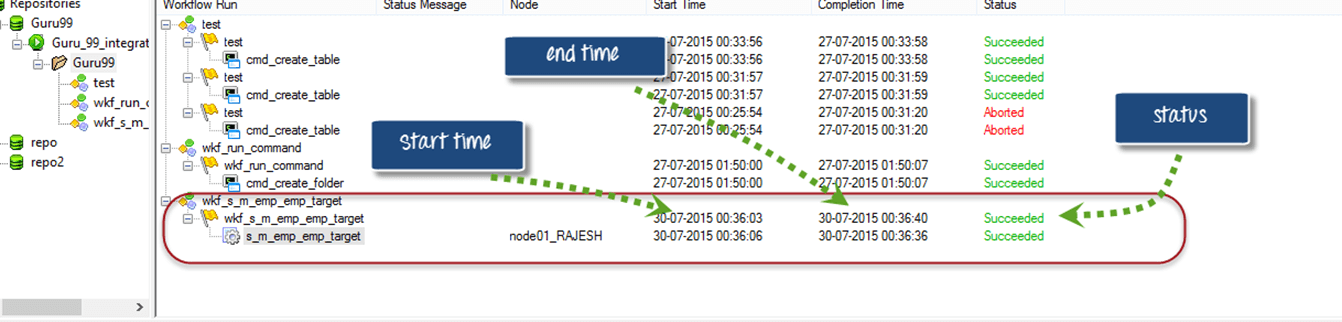
Step 2) Go to Workflow Monitor and in the monitor window you will see details as shown in the screenshot like repository, workflow run details, node details, workflow run start time, workflow run completion time and status.

Step 3) Here you can view the currently running workflow, which is having status as “running”.

Step 4) Once the workflow execution completes, its status would change to succeeded/failed along with start and end time details.
Step 5) To view the task details
- Right-click on the task name
- In the pop-up window select “Get Run Properties”
- A properties window would appear with the task details

Step 6) Click each menu of the properties window to view specific details.
Task Details
Here we chose “Task Details” to view. It will display all the details like Instance Name, Task Type, Start Time, Integration Service Name, etc.

Source and Target Statistics
Source and target statistics give the details of source and target. For example, how many rows are fetched from the source, how many rows are populated in the target, the current throughput, etc.
In the following screen, 14 records are fetched from the source, and all 14 are populated in the target table.
- Applied rows signify how many records Informatica had tried to update or insert into the target
- Affected rows signify how many of the applied rows actually succeeded. Here all 14 rows are successfully loaded in the target, so the count is the same for both.
- Rejected rows signify how many rows are dropped due to a target constraint or other issues.

In this tutorial, you have learned how to open and monitor the workflows and tasks using Workflow Monitor. When statistics do not explain a failure, trace the data with the Informatica debugger.
