
How to Download & Install DataStax DevCenter on Windows
 Editorial Team
⚡ Smart Summary
DataStax DevCenter is a visual CQL query tool and DataStax OpsCenter is the cluster monitoring console for DataStax Enterprise. This page walks through downloading, installing, connecting and running both tools step by step.
What is DataStax DevCenter?
DevCenter is the front end query tool where you can write your query and execute it. DevCenter is provided by DataStax.
DevCenter is now a legacy tool: DataStax archived it as unsupported and points developers at DataStax Studio instead.
| Query tool | Interface | Status |
|---|---|---|
| DevCenter | Desktop editor | Archived, unsupported |
| cqlsh | Command line | Ships with Cassandra |
| DataStax Studio | Browser notebook | Named successor |
How to Download & Install DataStax DevCenter
Here are the steps to download and install DataStax DevCenter:
Step 1) Download DataStax DevCenter
First of all, download DevCenter from the DataStax official site. A Java runtime must already be present, because DevCenter is a Java application.
Step 2) Execute the .exe file
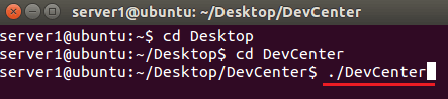
Go to DevCenter directory and execute DevCenter executable file, as shown below.
After running the executable, following page will be displayed. Below form is the user interface for DevCenter.
Step 3) Create connection with Cassandra Enterprise server
In this step, you have to create a connection with the Cassandra enterprise server. Go to connection window and click on the icon highlighted in the screenshot below.

- Make sure that Cassandra enterprise server is running
- Click on the red rectangle (in the above screen shot) for creating a connection.
Step 4) Add connection details
After clicking on it, you will be redirected to the connection form. Fill in the values below:
- Give connection name, you can give any connection name. This is a label only, so any readable value works.
- Provide IP address of the node as Contact hosts.
- Provide port number, by default port, is 9042, the native transport port.
- Next select compression type
- After providing this information, press finish button.
The completed connection form looks like this:

After this, DevCenter should run successfully.
Here is the screenshot that displays different parts in the DevCenter user interface.

Step 5) Establish a connection and run the query
- Select “connection” from the drop down. Usually, you have only one connection, the one you just created.
- Select keyspace from the drop down from which you want to query data.
- Select a number of records that you want to retrieve and display on the DevCenter user interface.
- Press the execute button to run the query.
The keyspace drop down lists every keyspace on the cluster. The system provides us with some keyspaces like System_traces and System, while some keyspaces are created by the user such as nhanes_ks.
Here is the screenshot that shows how to query data and where query results are displayed.

- Write query on the above form where the number is displayed. Select the query and press
 execute button.
 - After query selection and execute the button, you will be displayed the query result as shown above with number 2. There are two columns in the table testtable in the java_api keyspace. Column names are id and name. There are only two records in the table testtable.
 execute button.
What is DataStax OpsCenter?
OpsCenter is the visual management and monitoring tool for Apache Cassandra and DataStax Enterprise. This is a very helpful tool for architects, database administrators, and database operators.
In large organizations, they have thousands of servers. It is very difficult to monitor these servers and to tell which server is running and which server is down. OpsCenter is the tool where you can monitor all the Cassandra nodes by sitting and watching on a single machine.
One limit matters here: OpsCenter manages DataStax Enterprise clusters, not open-source Apache Cassandra. Open-source clusters use a metrics exporter feeding Prometheus and Grafana, or a platform such as AxonOps.
How to Download & Install DataStax OpsCenter
Here is a step by step process on how to download and install DataStax OpsCenter tool:
Requirements
- You must have running Cassandra enterprise server for OpsCenter installation.
- You must have OpsCenter setup for Linux.
Step 1) Go to the OpsCenter directory and run OpsCenter. After running the OpsCenter, following page will be displayed.

This page provides OpsCenter version information. Press the next button
Step 2) After pressing next button, following page will be displayed.
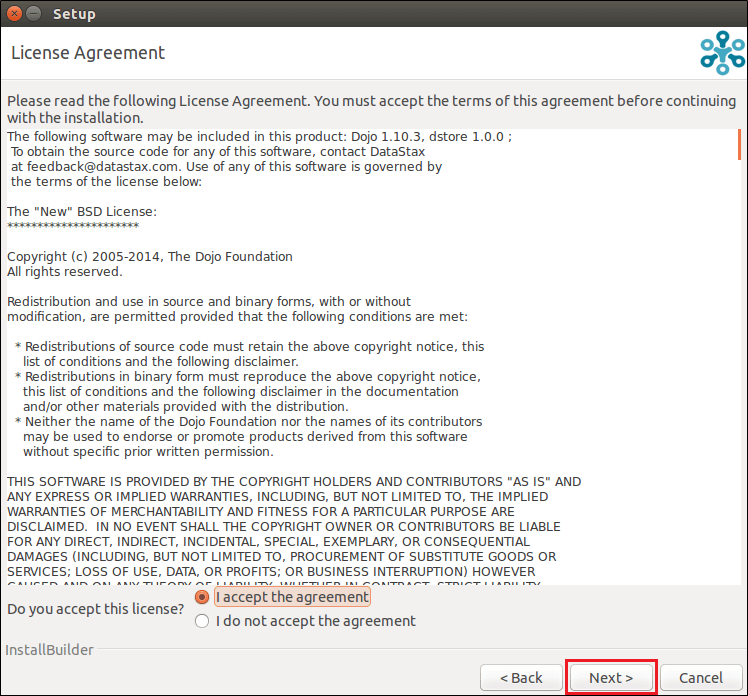
This page is about the agreement. Accept the agreement and press the next button.
Step 3) After pressing the next button, following page will be displayed.

This page asks about the installation options.
- Select install type, choose Simple Install
- Check no to update system
- Select IP address of the machine.
- Press the next button
Step 4) After pressing the next button following page will be displayed.

OpsCenter is ready to install, press the next button
Step 5) After pressing the next button following page will be displayed.

Setup is being installed. After setup is successfully installed, press next button.
Step 6) After pressing next button following page will be displayed.

Setup has been installed successfully, press finish button.
Before starting OpsCenter, DataStax agents need to be installed on each node. The agent collects metrics locally, so a node without one stays invisible on the dashboard.
Step 7) First of all, you need to install the DataStax agent on each node.
For installing DataStax agent, go to the datastax-agent directory in the dse directory and run the below command.

After running this command, datastax-agent will be installed on the node. Do the same procedure for all the nodes in the cluster.
Step 8) For running OpsCenter, run the below command

After running the above command, OpsCenter will run successfully.
Step 9) For watching OpsCenter user interface, go to web browser and type in URL http://localhost:8888. Port 8888 is the OpsCenter default.
The following page will be displayed

Here is the monitoring tool where you can monitor all the nodes. You can find information about how much space on the disk is filled and how much space remains.
