
How to use Quick Test Professional IDE?
 Editorial Team
⚡ Smart Summary
Quick Test Professional IDE, now shipped as Micro Focus UFT One, gives automation engineers a single workspace to launch the tool, manage add-ins, edit VBScript steps, and inspect test data before every run.

Quick Test Professional (QTP), now distributed as Micro Focus UFT One, opens directly into an integrated development environment built for recording, scripting, and debugging automated tests. The sections below walk through every pane a tester touches, from the first launch screen to the toolbars, data sheets, and debug windows used on a daily basis.
Launch UFT
To launch HP QTP from the Windows Start Menu, choose Programs > Quick Test Professional Folder > Quick Test Professional, or double-click the HP UFT icon on the desktop. Either route opens the same startup sequence described below.

Add-in Manager
The first time you start Micro Focus UFT, the Add-in Manager dialog box opens and displays a list of every installed add-in. Select the add-ins to load for the test and click “OK.” An add-in can be added or removed later, after QTP has launched, so it is safe to stick with the defaults for now.

The recommendation is to select only the add-ins required for a particular testing session, because different add-ins can interfere with each other and degrade object identification and QTP’s performance. QTP remembers the add-ins loaded in one session and pre-selects them the next time QTP opens. Clear the “Show on startup” checkbox if this dialog box should not open on the next launch, then click OK.
Start Page
The Start Page describes the new features in the current release, including links to more information about each one. It also links to Process Guidance, a tool that offers best practices for working with QTP. Open a document from the list of recently used files, or use the buttons in the Welcome area to create a new document or open an existing one.

The Start Page also lists the important components of the IDE, each of which is covered in more detail further down this page:
- Menu bar
- Properties window
- Document tab
- Solution Explorer
- Toolbox tab
- Output tab
- Active Screen
- Data tab
Clear the “Don’t show the Start Page window on startup” checkbox if the Start Page should not appear the next time QTP opens. Selecting this option also hides the Start Page for the current session as soon as another QTP document opens. To display the Start Page again later, select View > Start.
Test Pane: Keyword View and Expert View
Every action in UFT is designed and viewed through the Test Pane, which offers two interchangeable views of the exact same steps: Keyword View and Expert View, covered in more depth in the Keyword and Expert View reference. Since UFT 11.5, a single toggle button on the toolbar switches between them, replacing the tabbed interface used in QTP 11 and earlier.
Keyword View displays each test step as a row in a table-like grid, split into four default columns: Item, the object the step acts on; Operation, the method performed on it; Value, the argument passed to that method; and Documentation, an auto-generated, plain-English description of the step. Building a script in Keyword View requires no programming knowledge, because UFT writes the underlying VBScript automatically as objects and operations are selected from drop-down lists.
Expert View shows the same steps as an editable VBScript script, one statement per line. The example below opens a login dialog, sets the agent name, clicks OK, and checks whether the dialog is still open:
' Same object hierarchy, written directly in Expert View
Dialog("Login").WinEdit("Agent Name:").Set "Guru99"
Dialog("Login").WinButton("OK").Click

If Dialog("Login").Exist(2) Then
	Print "Login dialog is still open"
End If
Here Dialog is the parent object, WinEdit is the child object one level down in the hierarchy, and Set is the operation applied to it. Objects in the hierarchy are always separated by a dot, and the operation together with its value sits at the end of the statement. Press Ctrl+Space inside the Editor to open a list of matching objects, properties, and methods while typing, which speeds up hand-written steps considerably.
Because Keyword View and Expert View represent the same underlying script, a step created in one view instantly reflects in the other, so testers can mix table-based editing with direct VBScript for advanced logic such as loops and conditions.
| Aspect | Keyword View | Expert View |
|---|---|---|
| Format | Table of Item, Operation, Value, Documentation columns | Line-by-line VBScript editor |
| Programming skill | Not required | Basic VBScript syntax required |
| Best for | Simple, linear steps built by selecting objects | Loops, conditions, and custom logic |
| Underlying script | Generated automatically | Same script, edited directly |
Active Screen, Toolbox, and Menus
Three more elements shape daily work inside the IDE: the Active Screen, the Toolbox pane, and the menu and toolbar system that ties every pane together.
- Active Screen: Captures a screenshot behind every recorded step, so a tester can add a checkpoint or change an object’s identification property by pointing at the saved image instead of re-running the application under test.
- Toolbox pane: Lists the test objects, drawn from the object repository, along with local and library functions available to the action currently in focus, and lets a tester drag any of them straight into a step.
- Menu bar and toolbars: Group every command by task. File, Edit, View, Test, and Resources menus sit above dedicated toolbars for recording, running, and debugging, and the same toggle button used for Keyword View and Expert View lives here.
- Document and Output tabs: The Document tab holds every open action as a separate tab in the design canvas, while the Output tab beneath it reports Print statements and missing-resource warnings from the last run.
Solution Explorer
The Solution Explorer is a hierarchical tree of every action and test in the current solution, along with their references, events, and flows, and it opens automatically on the left side of the IDE.

A Function Library, visible in the same tree, holds code or functions that can be reused across a test any number of times instead of duplicating logic inside every action.
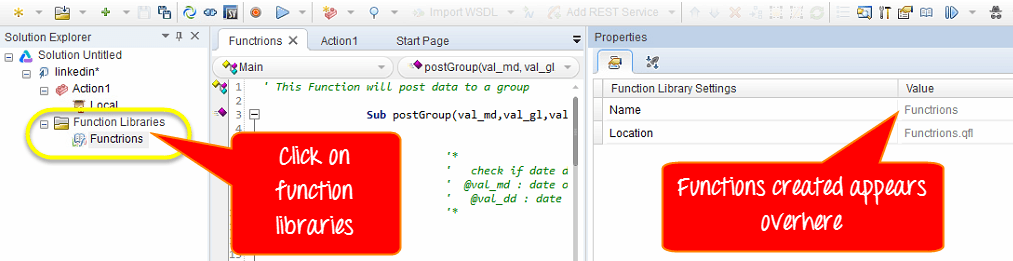
Selecting any function or action in Solution Explorer shows its detailed information on the right side of the panel, under the Properties panel.
Data Table
The Data Table stores every value used to parameterize a test, and it sits along the bottom of the window as its own tab. This panel is a tree hierarchy of the data sources available to the current test, split into a Global sheet shared by every action and local Action sheets scoped to one action each.

The Action tab of the Data Table gives details of the test code tied to that sheet, showing which rows a given action reads during a run.

Values entered directly into a Data Table cell, or pulled from an external spreadsheet, drive the same script across many combinations of input without changing a single line of VBScript.

Debug Viewer, Properties, and Errors Pane
Automated scripts fail for many reasons, and UFT groups its diagnostic tools into three panes so the cause is easy to isolate before a rerun.
The Debug Viewer is not one window but a set of sub-panes reached through View > Debug. Breakpoints lists every paused line in the current script, Call Stack shows the chain of functions active when a run pauses, Locals displays every variable in scope with its current value, and Watch tracks only the variables a tester selects. Set a breakpoint, run the script, and step through it line by line to confirm each variable holds the expected value.
The Properties pane, opened with View > Properties or Ctrl+Alt+P, edits a test’s settings, toggles an action between Reusable and Non-Reusable, and adds input or output parameters.
To view the errors encountered while performing automation testing, use the Errors pane from the bottom panel. It lists syntax errors, missing resources, and missing property values so each one can be fixed before the next run.

Move IDE Panes
Every pane described above can be moved to suit personal preference. Say the goal is to move the Solution Explorer to a new position.
In the QTP window, drag the title bar of the Solution Explorer. As the pane moves, markers appear in the active pane and along each edge of the QTP window.
Hold the cursor over the various markers while dragging; a shaded area shows where the pane will land. Release the mouse button over the Top marker, for example, and the Solution Explorer snaps into place as a new pane inside that shaded area.

