
Normalizer Transformation in Informatica with EXAMPLE
 Editorial Team
⚡ Smart Summary
Normalizer transformation in Informatica is an active transformation that converts a single row containing repeating columns into multiple rows, and it also generates the key columns that identify each occurrence it produces.

What is Normalizer Transformation?
Normalizer is an active transformation, used to convert a single row into multiple rows and vice versa. It is a smart way of representing your data in a more organized manner.
If in a single row there is repeating data in multiple columns, then it can be split into multiple rows. Sometimes we have data in multiple occurring columns. For example:
| Student Name | Class 9 Score | Class 10 Score | Class 11 Score | Class 12 Score |
| Student 1 | 50 | 60 | 65 | 80 |
| Student 2 | 70 | 64 | 83 | 77 |
In this case, the class score column is repeating in four columns. Using the Normalizer, we can split these into the following data set.
| Student Name | Class | Score |
| Student 1 | 9 | 50 |
| Student 1 | 10 | 60 |
| Student 1 | 11 | 65 |
| Student 1 | 12 | 80 |
| Student 2 | 9 | 70 |
| Student 2 | 10 | 64 |
| Student 2 | 11 | 83 |
| Student 2 | 12 | 77 |
Two rows of five columns have become eight rows of three columns. Because the number of rows leaving the transformation differs from the number entering it, the Normalizer is an active transformation, and the same rule applies to the sales example built in the next section.
How to Use Normalizer Transformation in Informatica
The following six steps build a mapping that reads a flat file of quarterly store sales and writes one target row per quarter.
Step 1) Create source table “sales_source” and target table “sales_target” using the script and import them in Informatica.
Download the above Sales_Source.txt File
Step 2) Create a mapping having source “sales_source” and target table “sales_target”. The Mapping Designer canvas then holds the source definition, its Source Qualifier and the target definition.

Step 3) From the Transformation menu create a new transformation. In the Create Transformation window:
- Select Normalizer as transformation
- Enter name, “nrm_sales”
- Select create option
The window looks like the screenshot below, with the transformation type list on the left and the name box underneath.
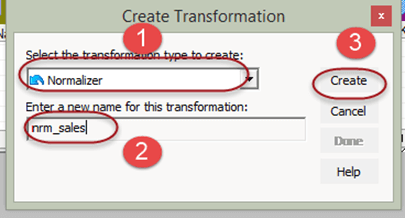
Step 4) The transformation will be created, select done option. The empty nrm_sales transformation now sits on the canvas between the Source Qualifier and the target.

Step 5) Double click on the Normalizer transformation, then:
- Select Normalizer tab
- Click on icon to create two columns
- Enter column names
- Set number of occurrence to 4 for sales and 0 for store name
- Select OK button
The Occurs value is the single most important entry on this tab: it tells the Designer how many times the column repeats in one source row. Store name appears once per row, so its Occurs value stays at 0.

Columns will be generated in the transformation. You will see 4 number of sales column as we set the number of occurrences to 4. Alongside them the Designer adds the generated key and generated column ID ports described in the next section.

Step 6) Then in the mapping:
- Link the four column of source qualifier of the four quarter to the normalizer columns respectively.
- Link store name column to the normalizer column
- Link store_name & sales columns from normalizer to target table
- Link GK_sales column from normalizer to target table
Once every link is drawn, the completed mapping looks like this.

Save the mapping and execute it after creating session and workflow. For each quarter sales of a store, a separate row will be created by the normalizer transformation.
The output of our mapping will be like –
| Store Name | Quarter | Sales |
| DELHI | 1 | 150 |
| DELHI | 2 | 240 |
| DELHI | 3 | 455 |
| DELHI | 4 | 100 |
| MUMBAI | 1 | 100 |
| MUMBAI | 2 | 500 |
| MUMBAI | 3 | 350 |
| MUMBAI | 4 | 340 |
The source data had repeating columns namely QUARTER1, QUARTER2, QUARTER3, and QUARTER4. With the help of the Normalizer, we have rearranged the data to fit into a single column of QUARTER and for one source record four records are created in the target.
In this way, you can normalize data and create multiple records for a single source of data.
Normalizer Transformation Ports and Properties
Columns are never typed on the Ports tab. They are defined on the Normalizer tab, and the Designer then creates the matching ports automatically. The table below explains what each entry and each generated port does.
| Port or attribute | What it does |
| Occurs | Number of instances of the column in one source row. A value of 0 marks a single-occurring column such as store name. |
| Level | Groups columns into a record hierarchy. It is used for COBOL sources and stays at 0 for a flat structure. |
| Input ports | A pipeline Normalizer creates one input port per occurrence, so an Occurs value of 4 produces four input ports. |
| Output port | A multiple-occurring column has a single output port that returns one row per occurrence. |
| GK_<column> | Generated key. The Integration Service increments this sequence number every time it processes a source row. |
| GCID_<column> | Generated column ID. It is the index of the occurrence, so a column that occurs four times returns 1, 2, 3 or 4. |
The difference between the two generated ports is worth remembering, because both look like counters. GCID restarts at 1 for every source row, while GK keeps climbing across the whole session. In the sales mapping, GK_sales is the port linked to the target, so each of the eight output rows carries a distinct key.
Two settings on the Properties tab control how that key behaves between runs. Reset returns the generated key value at the end of the session to the value it held before the session started. Restart starts the generated key sequence at 1 each time the session runs, overriding the sequence value shown on the Ports tab. Full attribute definitions are published in the PowerCenter Transformation Guide.
VSAM Normalizer vs Pipeline Normalizer
PowerCenter ships two versions of the same transformation, and the example above uses the second one. Choosing between them is decided entirely by the source.
| Aspect | VSAM Normalizer | Pipeline Normalizer |
| Role in the mapping | Acts as the Source Qualifier for a COBOL source definition | Sits anywhere in the pipeline, downstream of a normal Source Qualifier |
| How it is created | Created automatically when the COBOL source is dragged into the mapping | Created from the Transformation menu, as in Step 3 above |
| Input ports for a repeating column | One input port for the whole multiple-occurring column | One input port for each occurrence of the column |
| Editing the columns | Change the COBOL source and recreate the transformation | Edit the columns on the Normalizer tab at any time |
| Typical data | Mainframe files using OCCURS and REDEFINES clauses | Repeating columns in relational tables and flat files |
A COBOL file can also hold several record types in the same physical file, which is why the VSAM version reads a copybook rather than a column list. For everyday ETL work against databases and delimited files, the pipeline Normalizer is the one to reach for.
Common Normalizer Transformation Errors and How to Fix Them
Most Normalizer problems trace back to two or three settings. The list below covers the ones that surface most often during development.
- The port list does not match the source. Too few or too many input ports almost always means the Occurs value is wrong. Reopen the Normalizer tab and set Occurs to the exact number of repeating columns, then relink the mapping, because changing Occurs rebuilds the ports.
- Occurs set on a single-occurring column. Giving store name an Occurs value greater than 0 multiplies rows that were never meant to repeat. Single-occurring columns stay at 0.
- Date columns cannot be defined. The Normalizer tab accepts String, Nstring and Number columns only, so a date has to be carried as a string and converted in an Expression transformation before it reaches the target.
- Row counts look wrong in the session log. Reading two source rows and writing eight target rows is correct behaviour for an Occurs value of 4, not a defect. The Normalizer is active precisely because those counts differ.
- Generated keys repeat or jump between runs. This is the Reset and Restart pair on the Properties tab. Restart forces the sequence back to 1 for every session, which is rarely wanted when the key lands in a warehouse table.
- Edits on the Ports tab will not stick. Ports are generated, not authored. Every column change belongs on the Normalizer tab, and for a VSAM Normalizer the change belongs in the COBOL source itself.
When several repeating groups have to be split at once, it is usually cleaner to use one Normalizer per group and combine the results downstream than to overload a single transformation. Where the requirement runs the other way, collapsing many rows into one, an Aggregator transformation is the right tool instead.
