
JMeter Elements & Components: Thread Group, Samplers
 Editorial Team
⚡ Smart Summary
JMeter elements are the building blocks of every test plan: Thread Groups create virtual users, Samplers send the requests, Listeners display results, and Configuration Elements supply the defaults and data those requests need.

What is Element in JMeter?
The different components of JMeter are called Elements. Each Element is designed for a specific purpose.
The figure below gives some common elements in JMeter and shows how they sit under a Thread Group.

Studying all the components in one go is an invitation to confusion and boredom. Here, we will discuss the must-know components before you can start testing in JMeter.
The remaining components will be discussed as and when they are used in the succeeding tutorials. The elements discussed in this tutorial are listed below.
Thread Group
A Thread Group is a collection of threads. Each thread represents one user using the application under test. Basically, each thread simulates one real user request to the server.
The controls for a thread group allow you to set the number of threads for each group.
For example, if you set the number of threads as 100, JMeter will create and simulate 100 user requests to the server under test, as the diagram below illustrates.

The Thread Group panel also carries a ramp-up period, which spreads the start of those threads over time instead of launching every user at once.
Samplers
As we already know, JMeter supports testing HTTP, FTP, JDBC and many other protocols.
We also know that Thread Groups simulate user requests to the server.
But how does a Thread Group know which type of request (HTTP, FTP and so on) it needs to make?
The answer is Samplers.
The user request could be an FTP Request, an HTTP Request, a JDBC Request and so on. The figure below lists the samplers covered in this tutorial.
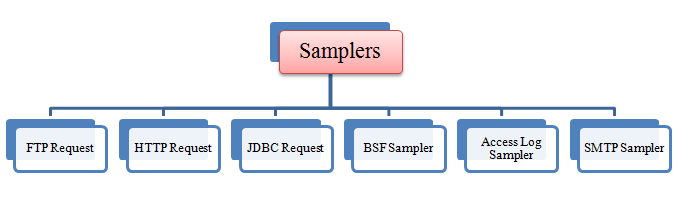
FTP Request
Let us imagine you want to performance test an FTP server. You can use an FTP Request sampler in JMeter to do this task. This controller lets you send an FTP “download file” or “upload file” request to an FTP server.

For example, if you want to download a file “Test.txt” from an FTP server under test, you need to configure some parameters in JMeter as in the figure below.

The panel sets the server to ftp.example.com, port 21, the remote file to Test.txt and the get(RETR) option, so JMeter sends an FTP command to that server and downloads the file.
HTTP Request
This sampler lets you send an HTTP/HTTPS request to a web server.
Consider the example below. JMeter sends an HTTP request to the Google website and retrieves HTML files or images from it.

In the tutorial JMeter Performance Testing, we will explain more about this HTTP Request. It is the sampler most web application testing work relies on.
JDBC Request
This sampler lets you execute database performance testing. It sends a JDBC Request (an SQL query) to a database.

For example, a database server has a field test_result stored in a table named test_tbl. You want to query this data from the database server, so you can configure JMeter to send a SQL query to this server to retrieve the data.
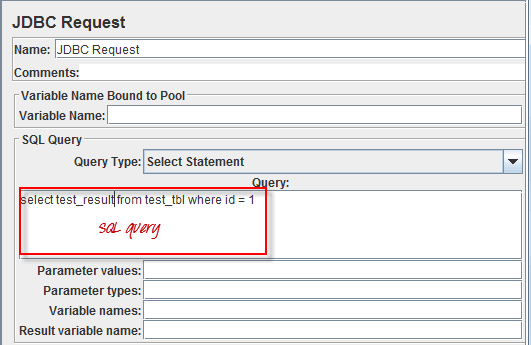
The Query Type here is Select Statement and the query reads select test_result from test_tbl where id = 1. A JDBC Connection Configuration element must supply the pool that the Variable Name field points at.
BSF Sampler
This sampler allows you to write a sampler using a BSF scripting language.
Here is an example of a BSF Sampler in JMeter, with fields for the script language, the parameters passed to the script and either an inline script or an external script file.

Deprecation note: the BSF family of elements was deprecated in favour of the JSR223 elements and no longer appears in the JMeter component reference. On current releases, use the JSR223 Sampler with Groovy, which compiles the script and performs far better under load. The panel above is kept here because older test plans still contain it.
Access Log Sampler
This sampler allows you to read access logs and generate HTTP requests. The log entries could be images, HTML, CSS and so on.

The Parser field defaults to org.apache.jmeter.protocol.http.util.accesslog.TCLogParser, and the Log File Location field points JMeter at the log you want replayed.
SMTP Sampler
If you want to test a mail server, you can use the SMTP Sampler. This sampler is used to send email messages using the SMTP protocol.

The panel groups server settings, mail addresses, authentication and message settings, and it prints the default ports beside the Port field: SMTP 25, SSL 465 and StartTLS 587.
Listeners
Listeners show the results of the test execution. They can present results in different formats such as a tree, a table, a graph or a log file.

The Graph Results listener displays the server response times on a graph, with the sample count, average, deviation, throughput and median printed underneath.

View Results Tree shows the result of each user request in basic HTML format, with a Sampler result tab reporting load time, latency, size and response code.

View Results in Table shows a summary of the test result in table format, one row per sample.

A log file records the same summary as text, which is what you keep when a test runs without the GUI.

Best practice: GUI listeners consume memory and skew results, so run real load tests in non-GUI mode and open the saved results file afterwards.
Configuration Elements
Configuration Elements set up defaults and variables for later use by samplers.
The figure below shows some commonly used configuration elements in JMeter.

CSV Data Set Config
Suppose you want to test a website for 100 users signing in with different credentials. You do not need to record the script 100 times. You can parameterize the script to enter different login credentials. This login information (for example, username and password) could be stored in a text file. JMeter has an element that allows you to read different parameters from that text file. It is “CSV Data Set Config”, which is used to read lines from a file and split them into variables.

This is an example of CSV data. It is a text file that contains the user names and passwords used to log in to your target website.
.png)
HTTP Cookie Manager
Let us understand this with an example.
You used your browser (Firefox, Chrome and so on) to browse www.google.com.
You log in with your user name and password.
Your user name and password will be stored on your computer as cookies.
Next time, when you visit www.google.com, you do not need to log in again, because your browser will use your cookies as user data to log in.
The HTTP Cookie Manager has the same feature as a web browser. If you have an HTTP Request and the response contains a cookie, the Cookie Manager automatically stores that cookie and uses it for all future requests to that particular website.
HTTP Request Defaults
This element lets you set default values that your HTTP Request controllers use.
For example,
You are sending 100 HTTP requests to the server google.com.
You would have to enter the server name google.com manually for all 100 requests.
Instead, you could add a single HTTP Request Defaults element with the “Server Name or IP” field set to google.com, as shown below.

No need to type it 100 times. This element will be explained in detail in the tutorial JMeter Performance Testing.
Login Config Element
The Login Config Element lets you add or override user name and password settings in samplers.
For example, you want to simulate one user logging in to the website www.facebook.com with a user name and password. You can use the Login Config Element to add this user name and password setting in a user request.

The Login Config Element vs. the CSV Data Set Config
| Login Config Element | CSV Data Set Config |
|---|---|
| Used to simulate one user login | Used to simulate multiple user logins |
| Suitable for login parameters only (user name and password) | Suitable for large numbers of parameters |
Between them, these two elements cover almost every credential scenario you meet in performance testing tools work.
