
LoadRunner Testing Tool: Architecture Diagram & Components
 Editorial Team
⚡ Smart Summary
LoadRunner is the enterprise performance testing tool, now sold by OpenText, that simulates thousands of virtual users across VuGen, Controller, load generators and Analysis to expose bottlenecks before real traffic finds them.
What is LoadRunner?
LoadRunner is a Performance Testing tool which was pioneered by Mercury Interactive in 1999. LoadRunner was later acquired by HP in 2006, and the HP software business merged with Micro Focus in a deal announced in 2016 and completed in 2017.
Brand note: OpenText completed its acquisition of Micro Focus in January 2023. The tool is no longer sold as HP or Micro Focus LoadRunner: LoadRunner Professional is now OpenText Professional Performance Engineering, LoadRunner Enterprise is OpenText Enterprise Performance Engineering, and LoadRunner Cloud is OpenText Core Performance Engineering. The component names below — VuGen, Controller, load generators and Analysis — are unchanged.
LoadRunner supports various development tools, technologies and communication protocols. It carries one of the broadest protocol libraries on the market for conducting Performance Testing. Performance Test Results produced by LoadRunner software are used as a benchmark against other tools.
LoadRunner Video
Watch the video below for a quick introduction to LoadRunner before working through the components.
Why LoadRunner?
LoadRunner is not only a pioneer tool in Performance Testing, it remains one of the market leaders in the Performance Testing paradigm and is still the reference point many enterprises benchmark against.
The protocol coverage is the clearest reason teams pick it, as the component map below shows.
Broadly, LoadRunner tool supports RIA (Rich Internet Applications), Web 2.0 (HTTP/HTML, Ajax, Flex and Silverlight etc.), Mobile, SAP, Oracle, MS SQL Server, Citrix, RTE, Mail and above all, Windows Socket. Few competing tools offer such a wide variety of protocols vested in a single tool, as the protocol list below illustrates.

What is more convincing to pick LoadRunner in software testing is the credibility of this tool. LoadRunner tool has long established a reputation as often you will find clients cross verifying your performance benchmarks using LoadRunner. You will find relief if you are already using LoadRunner for your performance testing needs.
LoadRunner software is tightly integrated with the sibling tools in the same suite — Unified Functional Testing (the former QTP, now sold as OpenText Functional Testing) and ALM (Application Lifecycle Management, now OpenText ALM/Quality Center) — which empowers you to perform your end to end Testing Processes.
LoadRunner works on the principle of simulating Virtual Users on the subject application. These Virtual Users, also termed VUsers, replicate the client’s requests and expect a corresponding response to pass a transaction.
Why do you need Performance Testing?
The industry estimates below are widely quoted and date from the early 2010s, but the pattern they describe has not changed: slow pages cost money.
An estimated loss of $4.4 billion in revenue is recorded annually due to poor web performance.
In today’s age of Web 2.0, users click away if a website does not respond within 8 seconds. Imagine yourself waiting for 5 seconds when searching for Google or making a friend request on Facebook. The repercussions of performance downtime are often more devastating than ever imagined. There are well-known examples such as those that hit Bank of America Online Banking, Amazon Web Services, Intuit and Blackberry.
According to Dun & Bradstreet, 59% of Fortune 500 companies experience an estimated 1.6 hours of downtime every week. Considering the average Fortune 500 company with a minimum of 10,000 employees is paying $56 per hour, the labor part of downtime costs for such an organization would be $896,000 weekly, translating into more than $46 million per year.
Only a 5-minute downtime of Google.com in August 2013 is estimated to have cost the search giant as much as $545,000.
It is estimated that companies lost sales worth $1,100 per second during a past Amazon Web Services outage.
When a software system is deployed by an organization, it may encounter many scenarios that possibly result in performance latency. A number of factors cause decelerating performance, few examples may include:
- Increased number of records present in the database
- Increased number of simultaneous requests made to the system
- A larger number of users accessing the system at a time as compared to the past
Not every application is a candidate, however. Load Testing targets client-server, multi-user systems, so a single-user desktop utility like the one below is not worth testing for performance.

What is LoadRunner Architecture?
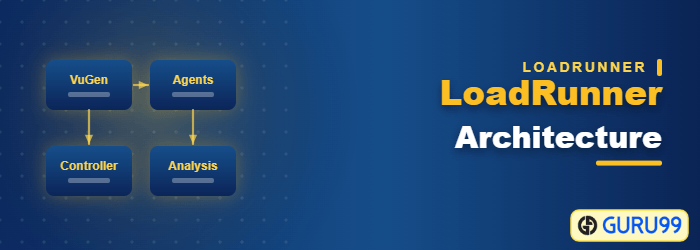
Broadly speaking, the architecture of LoadRunner is complex, yet easy to understand. The LoadRunner architecture diagram below shows how the four components hand work to each other.

Suppose you are assigned to check the performance of Amazon.com for 5000 users.
In a real-life situation, all these 5000 users will not sit on the homepage — they will be spread across different sections of the website. So how do we simulate that difference?
VuGen
VuGen or Virtual User Generator is an IDE (Integrated Development Environment) or a rich coding editor. VuGen is used to replicate System Under Load (SUL) behavior. VuGen provides a “recording” feature which records communication to and from client and Server in form of a coded script – also called VUser script.
So considering the above example, VuGen can record to simulate following business processes:
- Surfing the Products Page of Amazon.com
- Checkout
- Payment Processing
- Checking MyAccount Page
Once the script replays cleanly, dynamic server values usually have to be captured with correlation before it can be scaled up.
Controller
Once a VUser script is finalized, the Controller is one of the main LoadRunner components which controls the Load simulation by managing, for example:
- How many VUsers to simulate against each business process or VUser Group
- Behavior of VUsers (ramp up, ramp down, simultaneous or concurrent nature etc.)
- Nature of Load scenario e.g. Real Life or Goal Oriented or verifying SLA
- Which injectors to use, how many VUsers against each injector
- Collate results periodically
- IP Spoofing
- Error reporting
- Transaction reporting etc.
Taking an analogy from our example, the Controller will add the following parameters to the VuGen script:
- 3500 Users are Surfing the Products Page of Amazon.com
- 750 Users are in Checkout
- 500 Users are performing Payment Processing
- 250 Users are Checking MyAccount Page ONLY after 500 users have done Payment Processing
Even more complex scenarios are possible:
- Initiate 5 VUsers every 2 seconds till a load of 3500 VUsers (surfing Amazon product page) is achieved.
- Iterate for 30 minutes
- Suspend iteration for 25 VUsers
- Re-start 20 VUsers
- Initiate 2 users (in Checkout, Payment Processing, MyAccounts Page) every second.
- 2500 VUsers will be generated at Machine A
- 2500 VUsers will be generated at Machine B
Agents Machine/Load Generators/Injectors
The LoadRunner Controller is responsible to simulate thousands of VUsers – these VUsers consume hardware resources for example processor and memory – hence putting a limit on the machine which is simulating them. Besides, Controller simulates these VUsers from the same machine (where Controller resides) & hence the results may not be precise. To address this concern, all VUsers are spread across various machines, called Load Generators or Load Injectors.
As a general practice, Controller resides on a different machine and load is simulated from other machines. Depending upon the protocol of VUser scripts and machine specifications, a number of Load Injectors may be required for full simulation. For example, VUsers for an HTTP script will require 2-4MB per VUser for simulation, hence 4 machines with 4 GB RAM each will be required to simulate a load of 10,000 VUsers.
Taking the analogy from our Amazon example, the output of this component is the 5000 VUsers split across two injectors: 2500 VUsers generated on Machine A and 2500 on Machine B.
Analysis
Once Load scenarios have been executed, the role of the Analysis component of LoadRunner comes in.
During the execution, Controller creates a dump of results in raw form & contains information like, which version of LoadRunner created this results dump and what were configurations.
All the errors and exceptions are logged in a Microsoft Access database named output.mdb. The Analysis component reads this database file to perform various types of analysis and generates graphs.
These graphs show various trends to understand the reasoning behind errors and failure under load; thus help to figure whether optimization is required in SUL, Server (e.g. JBoss, Oracle) or infrastructure.
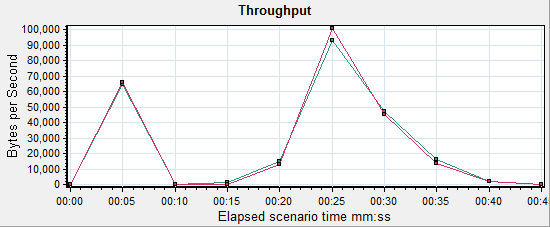
Below is an example where bandwidth could be creating a bottleneck. Let us say the Web server has 1GBps capacity whereas the data traffic exceeds this capacity causing subsequent users to suffer. To determine whether the system caters to such needs, the Performance Engineer needs to analyze application behavior with an abnormal load. Below is a graph LoadRunner generates to elicit bandwidth.
How to Do Performance Testing
Performance Testing Roadmap can be broadly divided into 5 steps, summarised in the roadmap below:
- Planning for Load Test
- Create VuGen Scripts
- Scenario Creation
- Scenario Execution
- Results Analysis (followed by system tweaking)
With LoadRunner installed, let us understand the steps involved in the process one by one.

Step 1) Planning for the Load Test
Planning for Performance Testing is different from planning a SIT (System Integration Testing) or UAT (User Acceptance Testing). Planning can be further divided into small stages as described below:
Assemble Your Team
When getting started with LoadRunner Testing, it is best to document who will be participating in the activity from each team involved during the process, as the team chart below sets out.

- Project Manager: Nominate the project manager who will own this activity and serve as point person for escalation.
- Function Expert / Business Analyst: Provides Usage Analysis of the SUL and expertise on business functionality of the website or SUL.
- Performance Testing Expert: Creates the automated performance tests and executes load scenarios.
- System Architect: Provides the blueprint of the SUL.
- Web Developer and SME: Maintains the website, provides monitoring aspects, develops the website and fixes bugs.
- System Administrator: Maintains involved servers throughout a testing project.
Outline applications and Business Processes involved
Successful Load Testing requires that you plan to carry out certain business process. A Business Process consists of clearly defined steps in compliance with desired business transactions – so as to accomplish your load testing objectives.
A requirements metric can be prepared to elicit user load on the system. Below is an example of an attendance system in a company:

In the above example, the figures mention the number of users connected to the application (SUL) at given hour. We can extract the maximum number of users connected to a business process at any hour of the day which is calculated in the rightmost columns.
Similarly, we can conclude the total number of users connected to the application (SUL) at any hour of the day. This is calculated in the last row.
The above 2 facts combined give us the total number of users with which we need to test the system for performance.
Define Test Data Management Procedures
Statistics and observations drawn from Performance Testing are greatly influenced by numerous factors as briefed earlier. It is of critical significance to prepare Test Data for Performance Testing. Sometimes, a particular business process consumes a data set and produces a different data set. Take below example:
- A user ‘A’ creates a financial contract and submits it for review.
- Another user ‘B’ approves 200 contracts a day created by user ‘A’
- Another user ‘C’ pays about 150 contracts a day approved by user ‘B’
In this situation, User B needs to have 200 contracts ‘created’ in the system. Besides, user C needs 150 contracts as “approved” in order to simulate a load of 150 users.
This implicitly means that you must create at least 200+150 = 350 contracts.
After that, approve 150 contracts to serve as Test data for User C – the remaining 200 contracts will serve as Test Data for User B.
Outline Monitors
Speculate each and every factor which could possibly affect the performance of a system. For example, having reduced hardware will have potential impact on the SUL (System Under Load) performance.
Enlist all factors and set up monitors so you can gauge them. Here are few examples:
- Processor (for Web Server, Application Server, Database Server, and Injectors)
- RAM (for Web Server, Application Server, Database Server, and Injectors)
- Web/App Server (for example IIS, JBoss, Jaguar Server, Tomcat etc)
- DB Server (PGA and SGA size in case of Oracle and MSSQL Server, SPs etc.)
- Network bandwidth utilization
- Internal and External NIC in case of clustering
- Load Balancer (and that it is distributing load evenly on all nodes of clusters)
- Data flux (calculate how much data moves to and from client and server – then calculate if a capacity of NIC is sufficient to simulate X number of users)
Step 2) Create VuGen Scripts
Next step after planning is to create VUser scripts, adding parameterization, transactions and run-time settings as the script matures.
Step 3) Scenario Creation
Next step is to create your Load Scenario in the Controller, choosing between a manual and a goal-oriented scenario.
Step 4) Scenario Execution
Scenario execution is where you emulate user load on the server by instructing multiple VUsers to perform tasks simultaneously.
You can set the level of a load by increasing and decreasing the number of VUsers that perform tasks at the same time.
This execution may result in the server going under stress and behaving abnormally. This is the very purpose of Performance Testing. The results drawn are then used for detailed analysis and root cause identification.
Step 5) Results Analysis (followed by system tweaking)
During scenario execution, LoadRunner records the performance of the application under different loads. The statistics drawn from test execution are saved and detailed analysis is performed. The Analysis tool (branded ‘HP Analysis’ in the releases this walkthrough was written against) generates various graphs which help in identifying the root causes behind a lag of system performance, as well as a system failure.
Some of the graphs obtained include:
- Time to the First buffer
- Transaction Response Time
- Average Transaction Response Time
- Hits Per Second
- Windows Resources
- Errors Statistics
- Transaction Summary
