MS Excel Notes 101 for Beginners
⚡ Smart Summary
Microsoft Excel is a spreadsheet program for recording, analysing, and visualising numerical data through a grid of cells, formulas, charts, and pivot tables. It runs on Windows, macOS, Android, iOS, and the web, and remains the standard tool for budgets and reporting.

This tutorial introduces the basics of Microsoft Excel so beginners can quickly become comfortable with the program and the concepts every Excel user relies on every day.
What is Microsoft Excel?
Microsoft Excel is a spreadsheet program used to record, analyse, and visualise numerical and statistical data. It provides a rich set of features — calculations, pivot tables, chart tools, macro programming, and now AI-assisted analysis — and is available on Windows, macOS, Android, iOS, and the web.
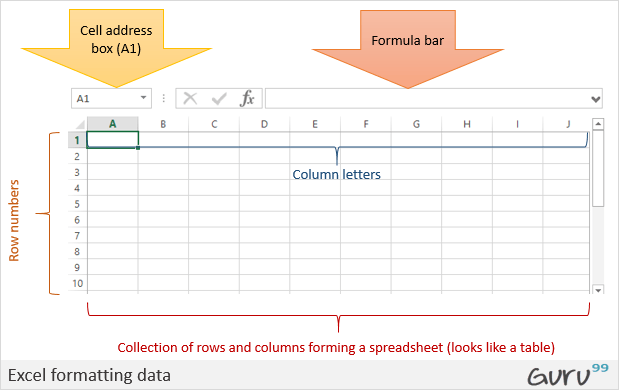
An Excel spreadsheet is a grid of columns and rows. Columns are labelled with letters and rows with numbers. The intersection of a column and a row is called a cell, and its address is the column letter followed by the row number (for example, A1, B12).
Why should I learn Microsoft Excel?
Most of us deal with numbers every day — income, expenses, prices, deadlines. Excel makes it easy to record, calculate, and analyse that data, then visualise it through charts and dashboards. The illustration below shows a simple monthly budget set up in Excel.
Where can I get Microsoft Excel?
Excel is part of the Microsoft 365 (formerly Office 365) suite. You can subscribe to Microsoft 365 directly from microsoft.com, buy a perpetual licence (Office Home & Business), or use the free browser-based Excel for the web through a Microsoft account.
How to Open Microsoft Excel
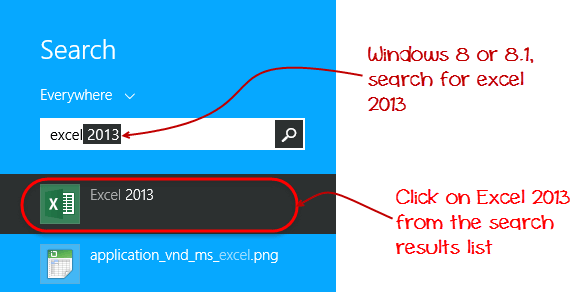
Opening Excel works like opening any other Windows application. On modern Windows 10 or 11 the steps are:
- Click the Start button.
- Type “Excel” — matching apps appear as soon as you start typing.
- Click Microsoft Excel in the results.
You can also pin Excel to the taskbar or the Start menu, or open it from a desktop shortcut.
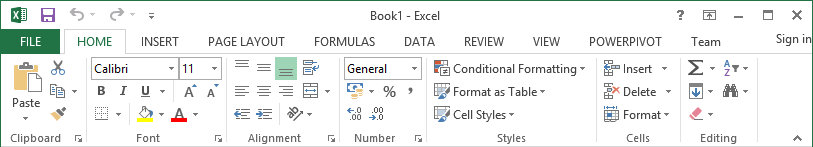
Understanding the Ribbon
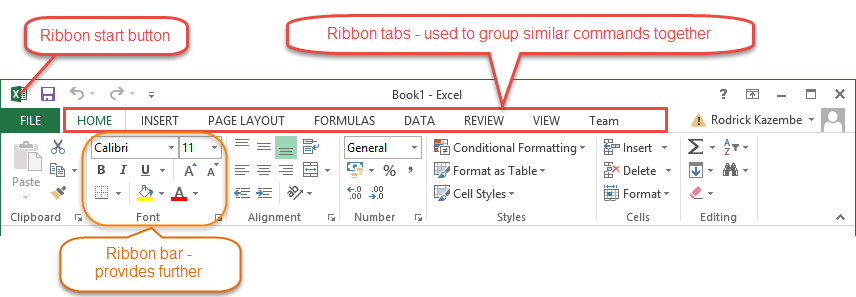
The Ribbon is the strip of tabs and icons at the top of the Excel window. It groups commands by task so you can find the right action quickly. A command is any action you perform — creating a new document, printing a file, applying a chart, and so on.
Ribbon components explained
- File menu (start button): opens commands such as New, Open, Save, Print, and Options to customise Excel.
- Ribbon tabs: group related commands. The Home tab covers formatting, sorting, and finding data.
- Ribbon groups: sub-sections inside each tab. For example, the Alignment group on the Home tab gathers every command that aligns cell content.
Understanding the Worksheet — Rows, Columns, Sheets, and Workbooks
A worksheet is a single grid of rows and columns. Where a row meets a column you get a cell, and each cell has a unique address such as C5. Columns are labelled with letters (A, B, C, …) and rows with numbers (1, 2, 3, …).
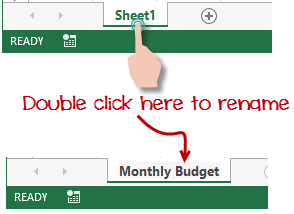
A workbook is the file that contains one or more worksheets. New workbooks open with a single sheet by default, but you can add or delete sheets as you need. Sheets are named Sheet1, Sheet2, and so on; rename them to something meaningful such as Monthly Budget or Daily Expenses.
Customising the Microsoft Excel Environment
Personal tastes vary — you may prefer a dark theme, want extra tabs such as Developer, or hide tabs you never use. Everything can be customised through File > Options. This section covers:
- Customising the Ribbon.
- Setting the colour theme.
- Formula settings.
- Proofing settings.
- Save settings.
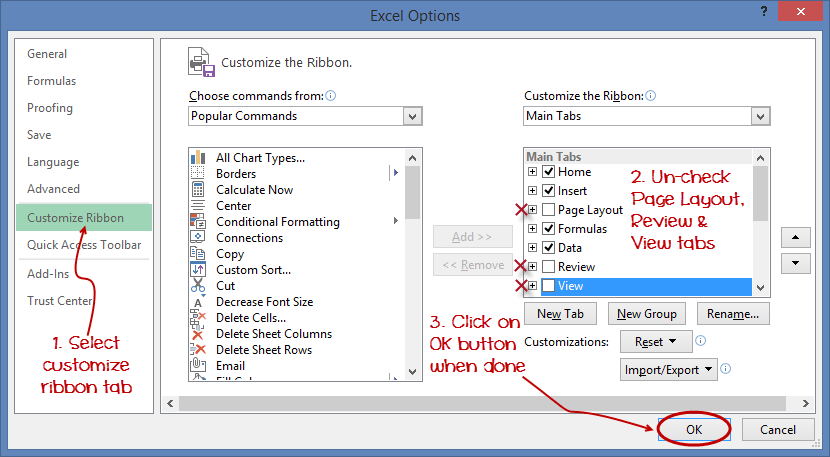
Customising the Ribbon
Open File > Options > Customize Ribbon to hide, add, or rearrange tabs.
- On the right-hand panel, untick the tabs you want to hide — for example, Page Layout, Review, and View.
- Click OK.
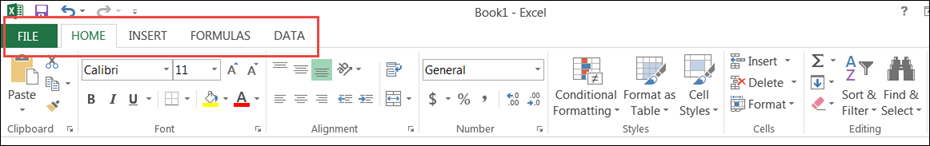
The Ribbon now looks like this:
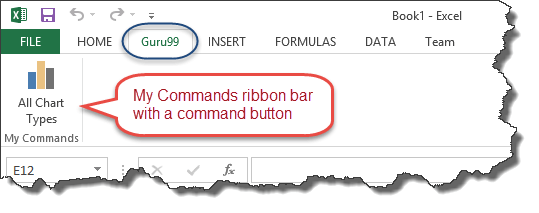
Adding a custom tab to the Ribbon
You can also create your own tab, name it, and assign commands to it. The example below adds a tab called Guru99.

- Right-click the Ribbon and choose Customize the Ribbon.
- Click New Tab.
- Select the newly created tab.
- Click Rename and call it Guru99.
- Select the new group inside the tab.
- Click Rename and call it My Commands.
- From the centre panel, select a command such as All Chart Types.
- Click Add, then OK.
The Ribbon now contains your custom Guru99 tab:
Setting the colour theme
To change the Excel colour theme, open File > Options and follow the steps below.
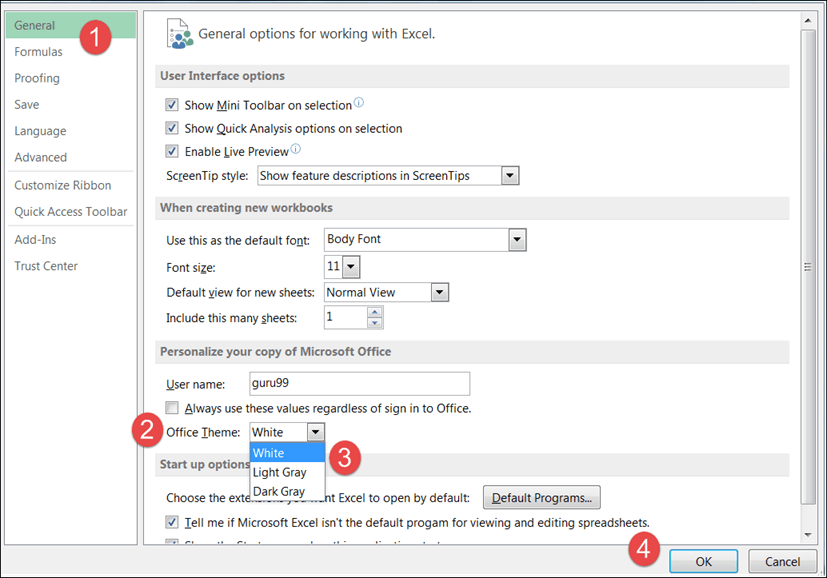
- The General tab on the left is selected by default.
- Find Office Theme (older versions: Color scheme) under Personalize your copy of Microsoft Office.
- Pick the desired theme from the drop-down.
- Click OK.
Settings for formulas
The Formulas tab controls how Excel behaves when you work with formulas — autocomplete, calculation mode, cell-reference style (A1 vs R1C1), and error checking.
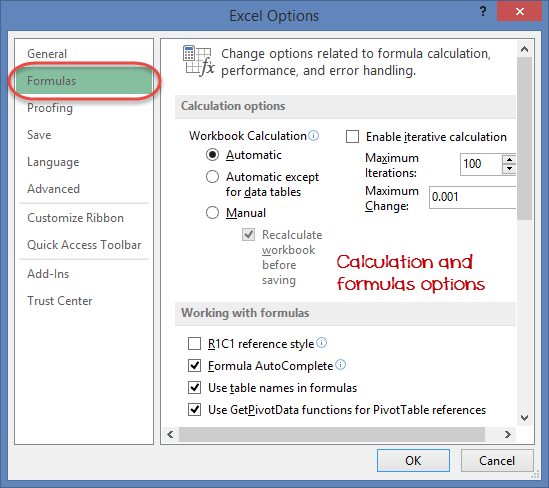
Tick a box to activate an option and untick it to disable. The same panel is reached through File > Options > Formulas.
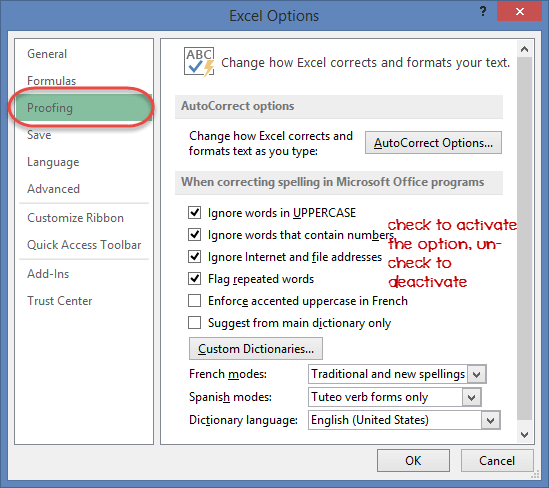
Proofing settings
The Proofing tab controls how Excel handles text you enter — dictionary language, AutoCorrect, spelling suggestions, and so on.
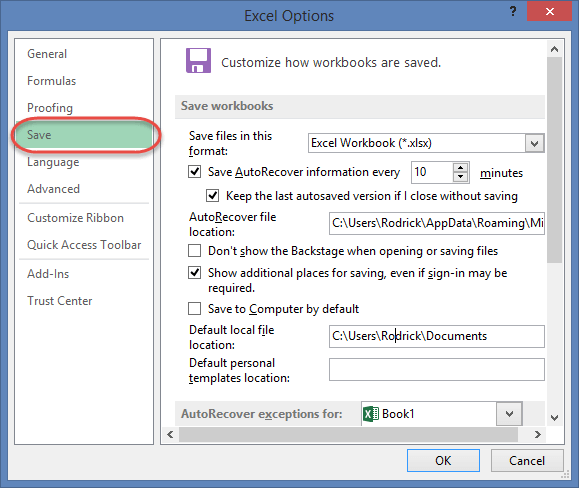
Save settings
The Save tab lets you set the default file format, the AutoRecover interval, and the location used for AutoRecover files. Use it to make sure work is never lost to an unexpected reboot.
Important Excel Shortcuts
The shortcuts below speed up everyday tasks.
| Shortcut | What it does |
|---|---|
| Ctrl + P | Opens the print dialog. |
| Ctrl + N | Creates a new workbook. |
| Ctrl + S | Saves the current workbook. |
| Ctrl + C | Copies the selected cells. |
| Ctrl + V | Pastes from the clipboard. |
| Ctrl + Z | Undoes the last action. |
| Ctrl + F | Opens Find & Replace. |
| Shift + F3 | Opens the Insert Function dialog. |
| Shift + F11 | Creates a new worksheet. |
| F2 | Edits the active cell and shows the formula’s cell range. |
Best Practices When Working with Microsoft Excel
- Save in a current format: use the modern
.xlsxformat unless you must share with someone on Excel 2003 or earlier. - Use descriptive names for columns, sheets, and named ranges.
- Avoid mega-formulas: break complex calculations into intermediate helper cells you can verify step by step.
- Use built-in functions such as
SUMIF,XLOOKUP, andFILTERbefore writing custom logic. - Lock and protect critical formulas so collaborators don’t overwrite them.
- Back up and version: save copies to OneDrive or SharePoint so version history is automatic.
Microsoft Excel vs Google Sheets
If you are choosing a spreadsheet tool, the table below summarises the key differences between Microsoft Excel and Google Sheets.
| Capability | Microsoft Excel | Google Sheets |
|---|---|---|
| Installation | Desktop app and web; Microsoft 365 subscription. | Browser-only; free with a Google account. |
| Offline use | Full desktop functionality. | Limited via the Chrome extension. |
| Collaboration | Real-time co-authoring through OneDrive/SharePoint. | Real-time co-authoring built in. |
| Power features | Power Query, Power Pivot, VBA macros, Copilot. | Apps Script, BigQuery connector, Gemini in Sheets. |
| Best for | Heavy modelling, large datasets, finance. | Lightweight collaboration and form-driven data. |