
Loadrunner Controller Tutorial: Manual & Goal Oriented Scenario
 Editorial Team
⚡ Smart Summary
Controller in LoadRunner turns finished VuGen scripts into a running load test: it assembles VUser groups, spreads them over load generators, schedules the ramp, and streams live results while the scenario executes.
What is Controller?
Controller, as the name suggests, is a program to “control” overall load test. It is responsible for helping you run your performance test design using the VuGen scripts you’ve already created. It lets you over-ride run-time settings, enable or disable think time, rendezvous points, adds load generators and controls the number of users each generator can simulate. It automatically creates a dump of execution results, gives you a live view of “current state” of load test running.
Let’s learn more about the LoadRunner Controller.
Brand note: the screens below come from the HP-era release, and the product later passed to Micro Focus and is now sold as OpenText Professional Performance Engineering. The Controller, VuGen, load generators and Analysis keep the same names and the same workflow, so every step here still applies.
How to Launch Controller
To launch the Controller, go to Start Menu ->HP Software ->HP LoadRunner ->Controller as demonstrated below:

After you’ve launched, you’ll see a splash screen appearing momentarily. A quick snap has been displayed below:
The snapshot will automatically lead to the main window of the Controller. Let’s have a look at it before we discuss main components of the screen.

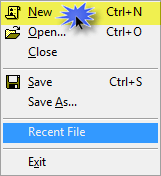
If the “New Scenario” screen doesn’t come up automatically, (after you’ve changed the preference) you can click on New button under File Menu or click on  button from the toolbar. Alternatively, you can click Ctrl + N. The menu has been displayed below for reference.
Similarly, to open an existing or previously created scenario you can use Ctrl + O or  icon, and it will open a standard dialogue box to browse files. The extension of a LoadRunner Scenario file is *.lrs
There are two types of scenarios in Controller.
- Manual Scenario
- Goal-Oriented Scenario
Manual Scenario can further or may not have Percentage Mode. We will discuss each in detail.
Simulating a Manual Scenario
A manual scenario is static and gives more control over the situation. You can decide which transaction to execute, how many times, and for how long.
Based on the composition of test mix, you can see application behaviour such as number of hits, response time, etc.
You will find out how a manual scenario is different from a Goal-Oriented scenario later.
In order to create a Manual Scenario, select Manual Scenario from “Select Scenario Type”
For now, let’s use non-percentage mode, to begin with. Have a look at the snapshot illustrated below:

You can select the scripts you wish to add to the scenario right from the above screen. However, it is generally practiced to add the scripts later.
Click the OK button to proceed.
This will create a blank scenario and load it into the main screen. You will notice the Save button is enabled now. Have a look at the snapshot below:

Likewise, if you selected Percentage Mode while selecting type of scenario, the screen will appear slightly differently. Instead of number of users, it will show the distribution of users in percentage. Controller distributes users per assigned percentage automatically.
The rest is same. Refer to snapshot below:

If you do not create a Scenario at the start, you will notice the toolbar as below:

You can click on button to create a new blank Scenario. Once a scenario has been created, you can click on  button to Save a scenario or click Ctrl + S. Likewise, you can click on button to open an already existing scenario from your local computer drive.
The remaining button simply invokes other components of LoadRunner. The  button invokes VuGen and
  button invokes LoadRunner Analysis.
Once you add a VUser script or group, you will notice the subject toolbar will show additional icons. The new toolbar will look like this:

The new toolbar has 2 additional controls.
The  button opens the list of all Load Generators. In our case, we’re using “localhost” as a generator. This means that your local machine will be used by Controller as well as Generator to simulate virtual user load. The Network Virtualization Settings can be opened by clicking on
  icon. Network Virtualization requires Shunra NV for HP Software version 8.6 or higher installed in your machine. This integration enhances test accuracy by virtualizing production network conditions in the load and performance test environment. To incorporate Shunra NV for HP Software into your test environment, contact your HP service representative.
Version note: HP acquired Shunra in 2014 and the feature now ships as the vendor’s own Network Virtualization component, so current installations no longer need a separate Shunra product.
Now that you’ve created a new, blank LoadRunner Scenario, please make a note of the default configurations it ships with:
Scheduled by: Scenario
Run Mode: Real World schedule
Since a VUser script will be run by a group of VUsers, hence it is called a Group as well. The Group Name column will show the name of VUser Script once added. Let’s add our VUsers scripts into this scenario.
When a scenario is completely created, you will see below toolbar under Scenario Groups:

You can click on the  icon in the toolbar to add a VUser Group.
When you click on a cell under Group Name column, it will open a small box i.e.  – here you can see a quick list of recent VUser Scripts as well as Browse button. Refer to below screenshot.

You can select from the list or simply browse from desired directory. If you click the browse button, it opens a dialogue box similar to MS common dialogue box. Refer to below snapshot:

As you can see, you can browse VUser Scripts, GUI Scripts or QTP Scripts here. Please remember, a GUI or QTP script can only instantiate single user and cannot be used for “load simulation”. Can you tell yourself why a QTP script is available in Load Scenario?
The correct answer is that QTP scripts can be added to a Load Scenario to extract information:
Since LoadRunner script works based on request and response, this doesn’t include UI and data rendering duration. A QTP script will give 1 sample of Real user experience under load. Of course, the QTP script needs to have all the transactions applied through descriptive programming.
If you right-click on the grey area on the left, you will see a small menu appearing as in below screenshot:

You can click on the Add Group to browse your VUser script.
To remove a group, click on  button in the tool bar or right click on the group and select Remove Group – as shown below:

Tip: You can also click on  button to view Run Time Settings specific to the selected group. You can select multiple groups (by holding Ctrl + click) to apply Run Time Settings to selected groups at a time.
From the toolbar, you can click on Details button [  ] in toolbar to view all details pertaining to a VUser Group.

If you click More, it will show you a panel with 3 tabs. 1st tab, Rendezvous, will open by default:

You can also see the VUsers listed in the Vusers tab. If you’ve assigned IDs to VUsers, you’ll see them here.

You can also see list of all files in the Script folder. This saves navigating all the way to the end directory and shows only the relevant files.

We will study how to Schedule a group separately.
Once your scenario is ready, you can click on  button to start executing your scenario. Once you click the play button, you will notice the Controller switches from Design tab to Run tab.
The Controller Design view also lets you view a script as you run the scenario. This is helpful when you face errors. However, any changes you make in the script will not be reflected in the running scenario. Even when the scenario is not running, you need to view the details and click on REFRESH button for changes to take effect.
You can view a script directly from Controller by clicking on  button.
Likewise, you can see the current VUsers (yes, you can actually view them) by clicking on  button.
Once you’re good with configuration, you can hit the button or go to Running tab and click on  button.
At the start of execution of the scenario, Controller will implicitly create a temporary directory to dump the results. If the directory already exists, you will get a prompt:

If you select Yes, the previous dump will be lost. If you select No, you will see below window. You can opt to create a new directory for each result if you wish. However, consider running out of space shortly after that.

As soon as you hit OK, your scenario will start running. You will see users moving from Pending to Init columns and so on.
This is how an example execution will look like:
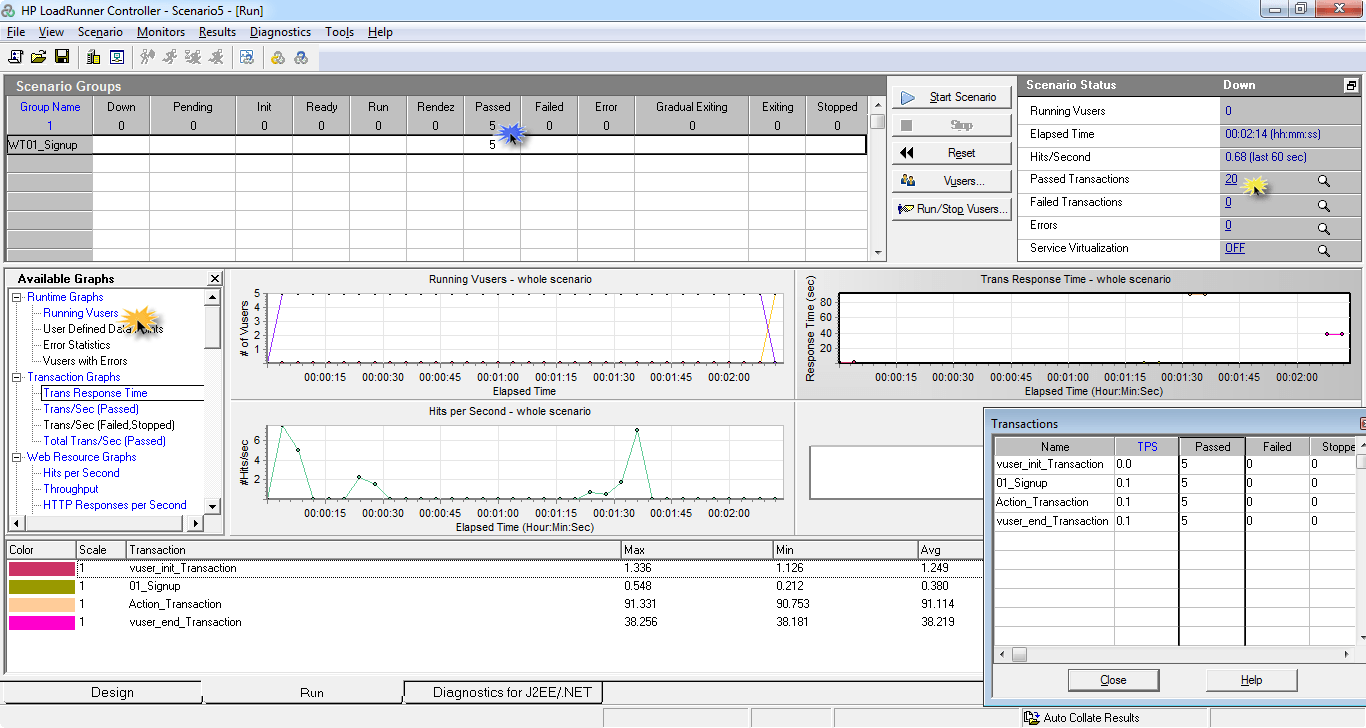
You can click on the Passed Transactions that opens a new window. Here you can check the status of transactions which you’ve applied throughout your scripts.
Similarly, you can click on any graph name on the left to open any graph.
In the bottom of the window, you can see which Transactions are passing, the minimum time taken by any user thus far, the maximum time, average time and standard deviation.
You can choose to collate results side by side or only after the end of scenario completion. For toggle, click on the Results menu and you will find below menu.

If you’ve wished to enable collation, you can keep it checked.
Simulating a Goal-Oriented Scenario
A Goal-Oriented scenario is dynamic in nature – this means, it keeps changing the overall load being simulated over the server. You set a Goal, for example, the maximum number of hits you wish to achieve for the target server, maximum response time against a transaction etc.
Based on above numeric, you can draw analytics such as the maximum number of users your application supports while staying within an acceptable response time. Similarly, you can find the maximum number of users connected to the application until X number of hits to the server is reached.
In such a case, the Controller automatically varies the number of users to the server, thus, you have little control over how many times or for how long a user runs.
Click New to create a new scenario and select Goal-Oriented Scenario.
The following screen will appear:

Process of adding VUser Groups is exactly same as in case of Manual Scenario.
The key difference in a Goal-Oriented Scenario, as the name suggests, is that you set a goal. The Controller will then automatically vary the number of VUsers until that goal is reached.
While most of the interface is pretty much similar to Manual Scenario, certain screens appear differently, although they perform the same actions. For example, to add a VUser Group or a VUser Script, click on the  button. This will lead to below window:

Here you can select recent scripts, browse for a script or hit the Record button to create a new script.
Click OK to close the window.
Per need, you can click  button to view the details of selected group/VUser Script.
Clicking  button will remove the selected VUser Group from the current scenario. The changes will be saved only if you save.
Clicking  button will open the Run Time Settings, as we studied in VuGen. However, if you override (or modify) the Run Time Settings here, the changes will be effective only for the current scenario. If you remove the script and reload, or hit refresh (in Details View), you will lose any changes made. This will reload the Run Time Settings saved while creating the script.
You can also click on  button to open the selected VUser Group in VuGen.
If you wish to configure Load Generators (our next topic) you can click on  button.
The table below draws together the difference promised earlier between the two scenario types.
| Aspect | Manual Scenario | Goal-Oriented Scenario |
| Who decides the load | You do, VUser by VUser | The Controller does, to reach your goal |
| Nature | Static once designed | Dynamic, varies during the run |
| You define | Transactions, VUser counts, duration | A goal such as hits per second or response time |
| Extra mode | Percentage mode distributes VUsers by share | No percentage mode |
| Best for | Reproducing a known test mix | Finding the load a target can sustain |
Execution of a Goal-Oriented Scenario is same as Manual Scenario.
Configure Load Generators
There are two ways to configure Load Generators.
When you click Add Group (to add a VUser Script), you will see below window:

You can click on Add corresponding to Load Generator Name and browse your Load Generators, or alternative, you can simply type “localhost” and start using your controller machine as Load Generator.
If you click on “add…”, you will see below window:
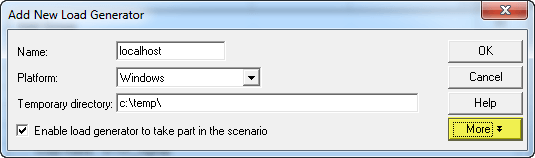
You can click on More to see more settings related to Load Generator. Navigate through different tabs to build more understanding:

The above were configurations to Run-Time Settings. As you can see, a maximum of 50 users can be initialized at one time.
Below is configuration of VUser Limit.

Click Defaults if you wish to revert to default settings and lose any changes you’ve made. Click OK button to save changes and close window.
Another way of adding and configuring Load Generators is by clicking Scenario menu and click Load Generators.

This will lead to main window of Generators. Here you can see the status of all Load Generators. The name refers to the name of the Generator. The Status is the current status, whether or not the generator is ready to be used. The Platform tells the Operating System of the generator which can be Windows or Unix only. The Type tells whether it’s local or Cloud based generator. Have a look at the below snapshot:

Platform note: the Windows-or-Unix wording reflects the release shown here. Current LoadRunner releases also install load generators on Linux distributions such as Ubuntu Server 22.04 LTS and RHEL 9.
To add another generator, you need to click on Add button. Once you click add, you will see the same screen as already discussed above.
Once generator has been configured, click Close button to close the screen.
Schedule a Group
Before you run your scenario, you need to configure schedule. Either you schedule by Scenario or by Group. Each of these can further be categorized by Real-world Schedule or Basic Schedule, called Run Mode.
If you schedule by Scenario and create a Real-World Schedule, you will see below options appearing in Global Schedule area:

However, if you schedule a Scenario and create a Basic schedule, you will see below window. Can you find difference?

You can also Schedule by Group. This will apply the configuration to group level. This can further be categorized as Real-world and Basic Run Mode.

Likewise, you can change the Run Mode to Basic Schedule. Use your Test Designing skills to find the difference between the two. Here is a reference:

Did you notice a new icon appearing in the Scenario Schedule toolbar?
Here it is for your reference: 
The Rendezvous icon is appearing only in case of Group configurations.
Set up the SLA (Service Level Agreement)
You may have signed a Service Level Agreement with your customers. The SLA in LoadRunner or Controller gives an opportunity to you to test your application against an SLA. Keep in mind, a regular (non-SLA) scenario gives you the opportunity to run various types of scenario in order to find the problems and root cause of problems; whereas, your customers might like to simply test your application under an SLA to see whether it works as assigned in the contract or not.
From the main Design View of Controller, find the SLA toolbar; that is on the right top corner and looks like this:

Click the  button and following window will open up:
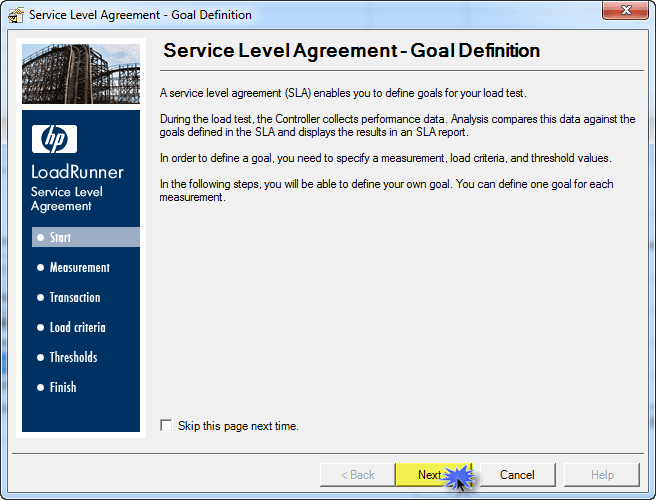
Click the  button.
Notice the new window. Here you can select the Measurement of the SLA. In our example, we’re taking Transaction Response Time. Have a look:
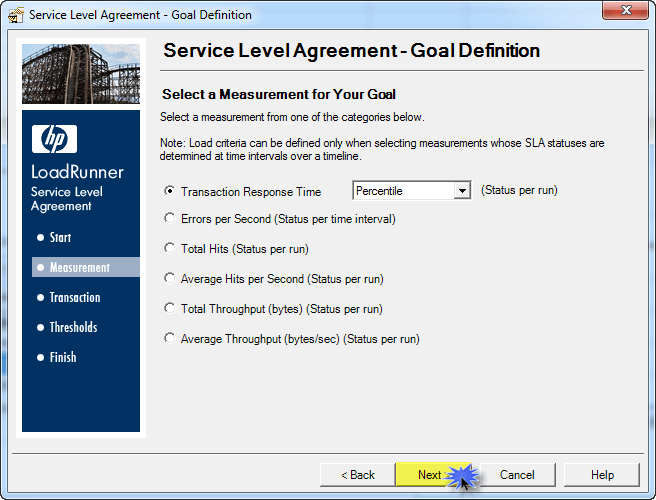
Click the button.
In the next window, you can select the Transactions where the above Measurement will be applied. We’re using only main transaction i.e. 01_Signup
This will help remove opening main page and other not so important transactions to be excluded.
Have a look at the window:
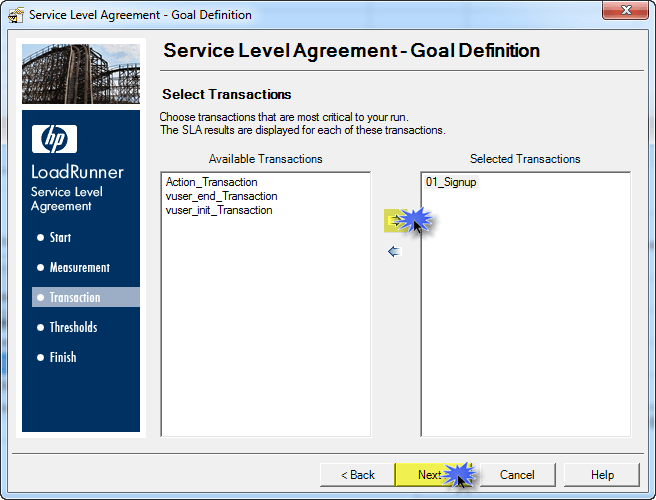
Click the button.
In the new window, you can select the percentile of the threshold value. If you’ve selected multiple transactions, you can click  button. Have a look at the below window:
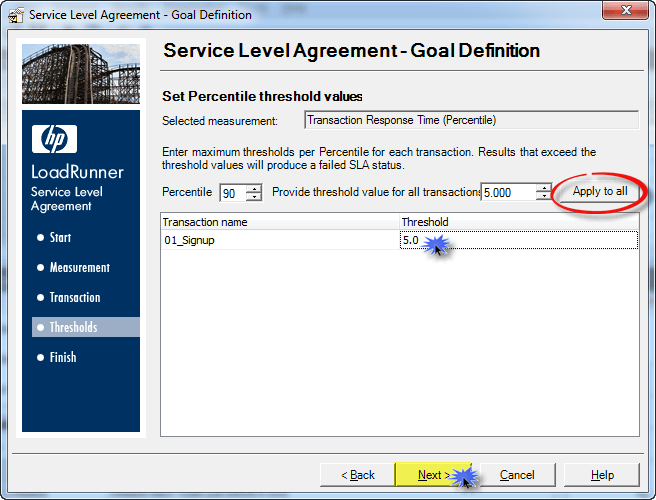
Click the button.
The next screen is a plain closure. Click the  button to close the SLA.
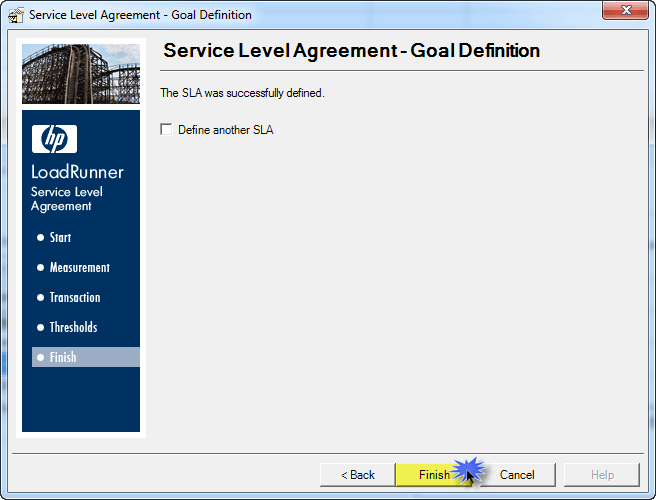
After you click , you will see the main, Design Window of Controller with an SLA appearing. Have a look:

You can click on the  buttons to view SLA details. The Following window will open up:
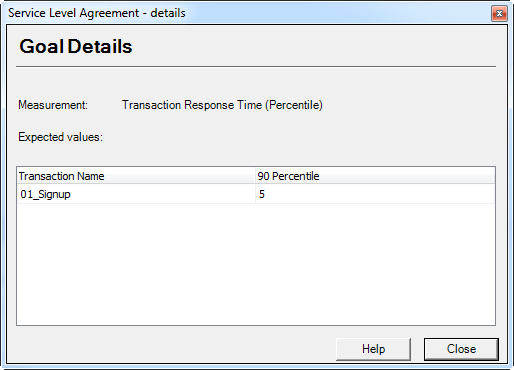
Click  button to close the above window.
If you wish to delete an existing SLA, you can click on the  button. Upon clicking, you will get to see below confirmation message:
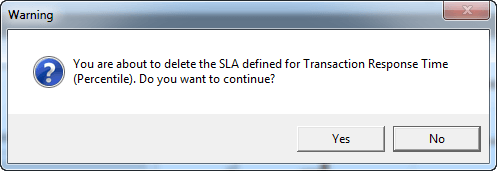
If you click on the  button, you will see Advance options of an SLA.
It is advisable that you work with default option i.e. Internally Calculated Tracking Period. Have a look at the snapshot:
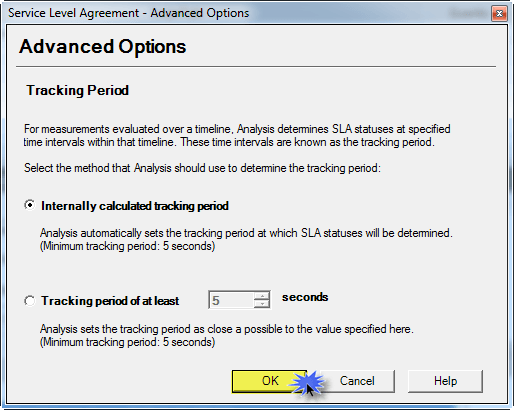
If you work with Internally Calculated Tracking Period, Analysis automatically sets the tracking period at which SLA statuses will be determined. This option has minimum tracking period set to 5 seconds.
On the other hand, you select Tracking Period to the desired number of seconds. Simply select the next radio button.
When executing an SLA based scenario, the execution process remains exactly the same.
Video on Controller
The walkthrough below covers the same Controller screens in motion.
Click here if the video is not accessible
The Controller sits in the middle of the LoadRunner architecture: scripts arrive from VuGen after correlation and parameterization, and the results dump feeds LoadRunner Analysis. Read Performance Testing and Load Testing for the wider process.
