SAP BEx Query Designer Tutorial
⚡ Smart Summary
BEx Query Designer in SAP BW is the standalone tool that builds queries on InfoProviders, defining characteristics, key figures, filters, and variables that shape how reports retrieve and present business data for analysis in the Business Explorer suite.

What is SAP BEx Query Designer?
The Business Explorer (BEx) is a component of SAP BI that provides flexible reporting and analysis tools for strategic analysis and decision-making in an organization. These tools include query, reporting, and analysis functions. SAP NetWeaver 7.0 provides the following BEx tools:
- BEx Query Designer
- BEx Web Application Designer
- BEx Broadcaster
- BEx Analyzer

The BEx tool can display past and present data at different levels of detail and from different perspectives. It can create planning projections using BI Integrated Planning, and BEx Information Broadcasting can distribute business intelligence content by e-mail, either as pre-calculated documents with historical data or as links with live data.
Query Designer: As the name suggests, it is used to define queries that retrieve data from SAP BW. Query Designer acts as the bridge between SAP BW InfoProviders and the reporting front-end tools (SAP BW / SAP BO). It limits the field list displayed based on requirements and defines the default placement of report objects. It also lets users define filters, selection screen variables (prompts), calculations, and unit conversions that are not available in InfoProviders.
Accessing Query Designer
To access the BEx Query Designer, follow the steps below:
Step 1)
- Navigate to Start -> All Programs.
- Under the folder “Business Explorer”, the “Query Designer” is available. Click on “Query Designer”.

Step 2)
- Select the required BW system.
- Click the OK button.

- Enter the Client.
- User Name.
- Password.
- Logon Language.
- Click the OK button.

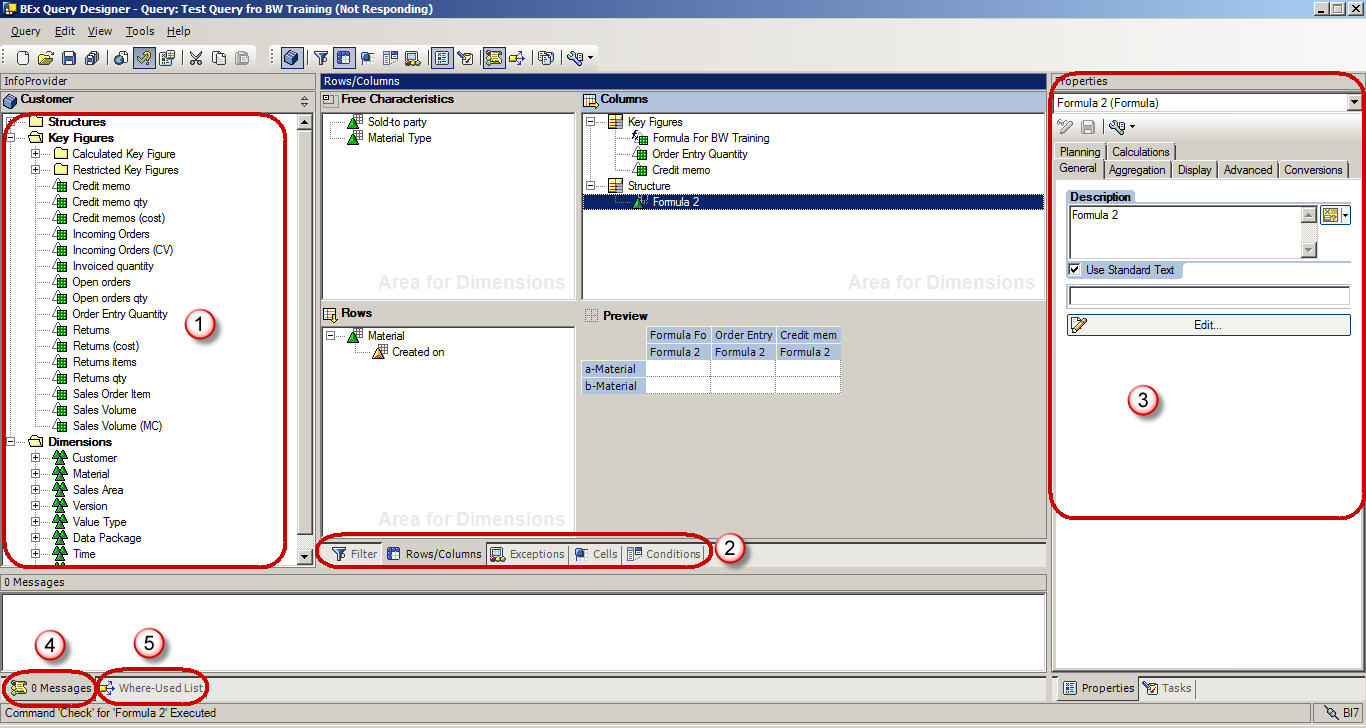
Query Panel
- InfoProvider details are available here.
- Tabs to view various report components.
- Properties box, which shows the properties of each component selected in the query.
- System Messages, such as any error or warning messages during the query check, are displayed here.
- Shows the Where-Used list of any component selected within the query.
Query Panel – Standard Toolbar
The Standard toolbar in the Query Designer has the following buttons.
- Create New Query
- Open Query
- Save Query
- Save All
- Publish on Web
- Check Query
- Query Properties
- Cut
- Copy
- Paste
- Toggle tabs for Filter and Rows/Columns
- Cells
- Conditions
- Exceptions
- Properties
- Tasks
- Messages
- Where Used
- Documents
- Technical names

Query Elements
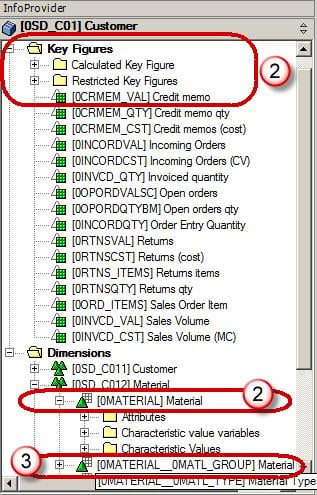
- Key Figures: Key Figures represent the numerical data or KPIs (Key Performance Indicators). They are further divided into Calculated Key Figures (CKF) and Restricted Key Figures (RKF).
- Characteristics: A characteristic provides the criteria according to which objects are classified, for example Material, Period, or Location.
- Navigational attributes appear as characteristics in the Query Designer.
Other Query Elements
- Dimensions: Similar characteristics are grouped together in a dimension. For example, the Time dimension consists of Year, Month, Week, and so on.
- Attributes: Attributes define the additional properties of a characteristic. For example, Material may have size, length, or width. A display attribute cannot be added to a query unless the related characteristic is also added, but you can set the characteristic property to “No Display”.

Query Properties
- Select the “Variable Sequence” tab. It controls the order in which selection screen variables are displayed to users.
- List the variables used in the query. Multiple variables can be present and sequenced as needed.

- Select the “Display” tab.
- The “Hide Repeated Key Values” check box controls whether the characteristic repeats in each row.
- The “Display Scaling Factors for Key Figures” option controls whether the scaling factor is reported at the top of the corresponding column.

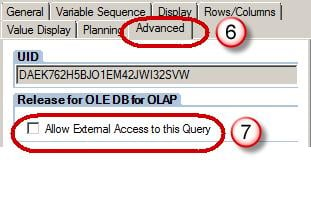
- Select the “Advanced” tab. It is most important from a BO perspective, as it controls whether the query is visible to BO. The option must be checked to allow query access to BO.
- The “Allow External Access to this Query” check box should be checked if this query is to be used from BO.
- Select the “Rows/Columns” tab.
- The options under “Result position” decide the location of the sub-total (results in BW) as below/above or right/left of the characteristics.
- The options under “Suppress Zeros” decide the application of zero-suppression on the query.

Filters
Filters restrict the data retrieved by a query. Filters can be dynamic or static. Static filter values cannot be overwritten by users at runtime, while dynamic filters or variables can be overwritten by the user or system during query execution.
Steps to apply filters in the query:
- Select the “Filter” tab.
- Filters can be applied in the “Characteristic Restrictions” section.
- Filters can be applied in the “Default values” section.

Characteristic Restrictions are applied before the data-fetch operation, while default values result in the entire data being fetched and the restriction applied only in the report front end. If “Clear all filters” is applied in WAD / Analyzer, the filters in Default Values are erased from the front end, but the filters applied via Characteristic Restriction still remain in force. It is recommended to have at least one or two characteristic restrictions when using a BW query for a BO Universe.
Variables
Variables are query parameters that you define in the Query Designer and that are filled with values only when you execute the query. Variables are reusable objects. The variables defined in the Query Designer are available in all InfoProviders. They do not depend on the InfoProvider, but rather on the InfoObject for which they were created.
Types of Variables:
- Characteristic values
- Hierarchies
- Hierarchy Nodes
- Texts
- Formula elements
Steps to create a variable:
Step 1)
- To create a variable, browse to the folder “Characteristic Value Variables” under the corresponding characteristic.
- Right click on the folder and select “New Variable”.

Step 2)
- In the subsequent window, enter the Description.
- Enter the Technical name.
- Variable Processing Types.
- Under reference characteristic, the variable can be assigned to either a specific InfoObject or all InfoObjects based on the same reference characteristic.

- Under the “Details” tab, specify whether the variable accepts:
- Single Value / Multiple Values / Range.
- Selection Option (allows any of the above at runtime; not supported in BW-BO).

Step 3)
- Click the “Default values” tab.
- Specify the default filter applied to the report. This value can be overwritten by the user at runtime.

Conditions & Exceptions
Conditions act as filters on key figures, for example the top 10 customers or products with the bottom 10% margin.
Exceptions are similar to “conditional highlighting” in MS Excel. They highlight rows, columns, or cells where the KPI value is above or below a certain threshold. As these are not imported to a BO Universe, they are not discussed in detail in this article.