
HTTP Proxy Server in JMeter: Record Example Script
 Thomas Hamilton
⚡ Smart Summary
JMeter HTTP Proxy Server records browser activity into a reusable test script. The recorder sits between browser and website, captures each request into a Recording Controller, and the saved plan is replayed by many virtual users.

What is the JMeter HTTP Proxy Server?
The JMeter HTTP Proxy Server is a built-in recorder that sits between the browser and the website under test. It watches and records user activity while the application is browsed normally, and turns each captured request into an HTTP Request sampler inside the test plan. Since JMeter 3.0 the element has been named the HTTP(S) Test Script Recorder, and both names describe the same component.
Record testing helps a tester record and replay activity against a test target. It is a type of automated testing, but for multiple users at once.
Why Record Instead of Building the Script by Hand?
A realistic user journey on a modern site produces dozens of requests, each with its own headers, cookies, and form parameters. Typing all of that into samplers by hand is slow and error prone. Recording captures the exact traffic the browser sent, which gives three advantages:
- Accuracy: Header order, cookies, and hidden form fields are captured exactly as the server received them.
- Speed: A ten-page journey takes minutes to record and hours to write manually.
- Coverage: Background AJAX calls that are invisible in the interface still appear in the recording.
The recording is a starting point rather than a finished test. It still needs cleaning, correlating, and parameterising before it is usable for load testing. The sections below cover the full path from an empty JMeter window to a script that replays reliably.
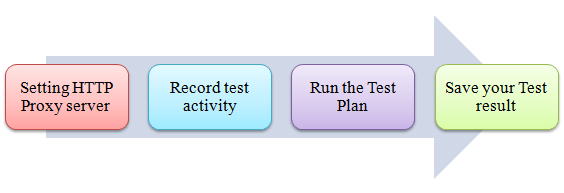
Here is the roadmap of this practical example
How to Record a Script in JMeter 5.x
The current release is Apache JMeter 5.6.3, published on 9 January 2024, and it requires Java 8 or later, with Java 17 recommended. Anyone following the illustrated walkthrough further down this page on that release will not find a WorkBench node, because it was removed in version 5.0. The functionality did not disappear; it moved. The recorder is now added directly to the Test Plan and is called the HTTP(S) Test Script Recorder.
The fastest route is the bundled template. Choose File > Templates > Recording and JMeter generates a complete plan containing a Thread Group, HTTP Request Defaults, a Recording Controller, and the recorder itself, already wired together. Building the same structure by hand takes the steps below.
- Build the plan skeleton. Add a Thread Group, then add a Recording Controller under it. This is where captured samplers will land.
- Add the recorder to the Test Plan. Right click the Test Plan node and choose Add > Non-Test Elements > HTTP(S) Test Script Recorder. It is a sibling of the Thread Group, not a child.
- Set the port. The default is 8888. Any free port works, provided the browser is configured to match.
- Choose the Target Controller. Select the Recording Controller created in step one, so requests are grouped where you expect rather than scattered at the plan root.
- Add URL exclusion patterns. On the Requests Filtering tab, exclude static resources with a pattern such as .*\.(bmp|css|js|gif|ico|jpe?g|png|svg|woff2?). This removes most of the manual clean up described later.
- Start the recorder. Click Start at the top of the recorder panel. JMeter writes ApacheJMeterTemporaryRootCA.crt into its bin folder at this moment, which is what makes HTTPS recording possible.
- Point the browser at the proxy using localhost and the chosen port, then navigate the application normally.
- Stop and tidy. Press Stop, delete any remaining third party calls, and save the plan.
- Validate before scaling. Right click the Thread Group and choose Validate. This runs the plan once with a single thread, so failures surface before any load is applied.
One more habit separates a working script from a reliable one. Use the graphical interface for building and debugging only, then run the real test from the command line with jmeter -n -t plan.jmx -l results.jtl -e -o report, which also generates an HTML dashboard. The same command is the basis of distributed testing across several load generators. Installation is covered in the JMeter installation guide, and the full procedure is documented on the Apache JMeter recorder page.
⚠️ Version note: The screens in the walkthrough below were captured on an older JMeter release that still had the WorkBench node. WorkBench was removed in JMeter 5.0. Every concept still applies; only the location of the recorder changes, and the current procedure is the one given above.
Step 1) Setting the HTTP Proxy server
This is a Step-by-step guide to setup proxy
- Start JMeter
- Select Test Plan on the tree
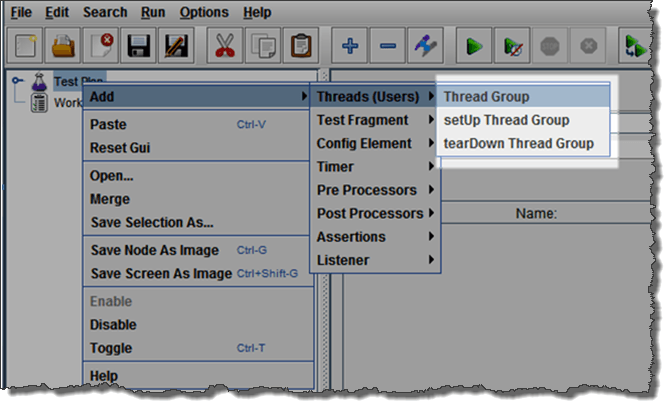
- Add Thread Group. Right click on the Test Plan and add a new thread group: Add > Threads (Users) > Thread Group
- Add HTTP Request. Select the Thread Group; right click Add > Config Element > HTTP Request Defaults
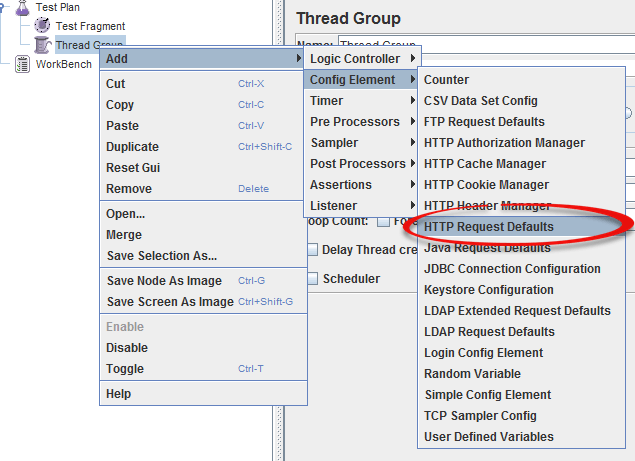
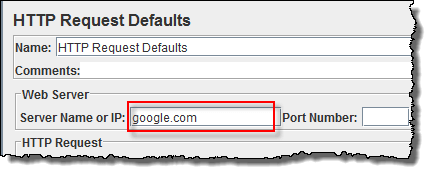
In new HTTP Request Defaults element: In Server name or IP, enter “google.com”. You should keep the others fields blank
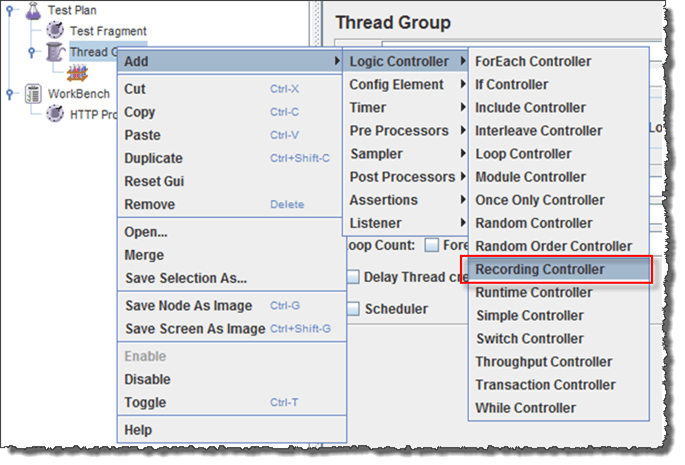
- Add Recording Controller. Right click on the “Thread Group” and add a recording controller: Add > Logic Controller > Recording Controller
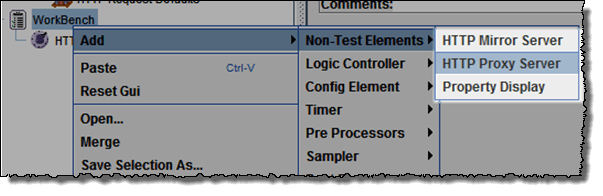
- Add Proxy Server to WorkBench. Right click on the Workbench and add the http proxy: Add > Non-Test Elements > HTTP Proxy Server. On JMeter 5.x, right click the Test Plan node instead and choose HTTP(S) Test Script Recorder.
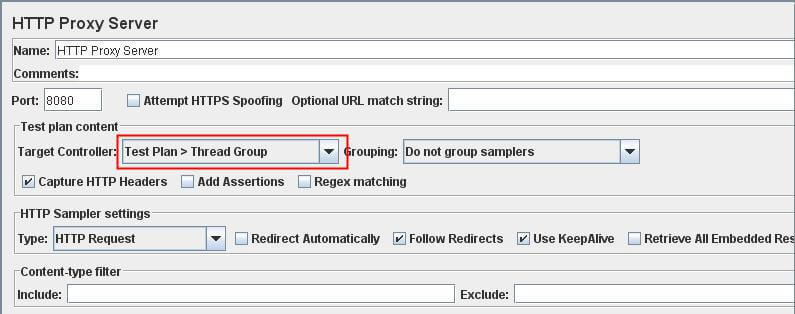
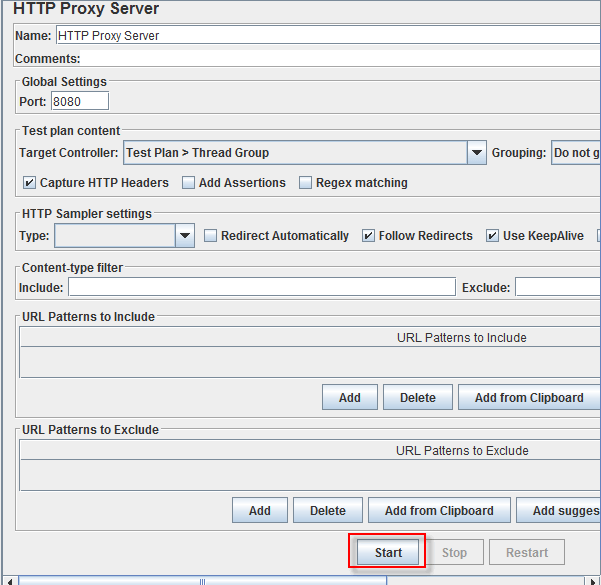
- Set Target Controller where your recorded scripts will be added
- Start Proxy Server. Return to HTTP Proxy Server, and click the Start button at the bottom. Now your JMeter proxy server start
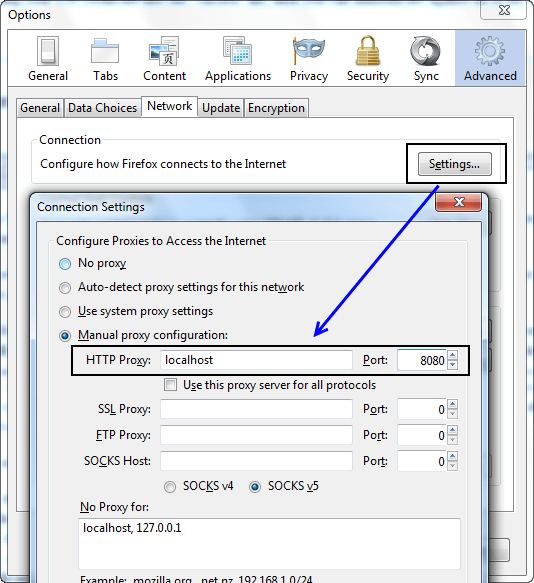
- Start your Browser (I used Firefox), choose Tool > Option > Advanced > Network > Setting > Enter HTTP proxy as figure below. In current Firefox releases the same dialog is reached through Settings > General > Network Settings.

Step 2) Record your activity
- Now Launch http://www.google.com in your web browser (JMeter still open)
- Do activities search the keyword “guru99“.
- Back to JMeter, in HTTP Proxy Server, click Stop when finished

- After finishing recording, you will see JMeter automatically created a new HTTP request as the figure below
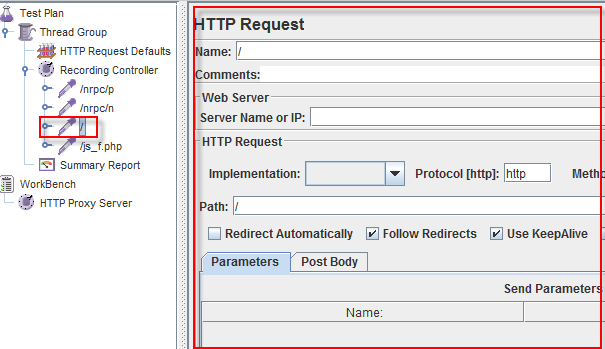
JMeter has already recorded a user request to the Home Page of Google website. http://www.google.com/
The other HTTP requests display in above figure, you should remove them. Because sometime JMeter also records some advertising links while you are searching keyword on Google. We should ignore them in our Test Plan.
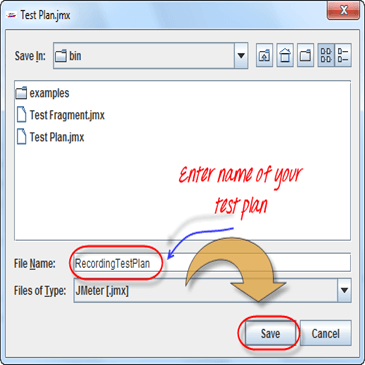
- Click File > Save your Test Plan as
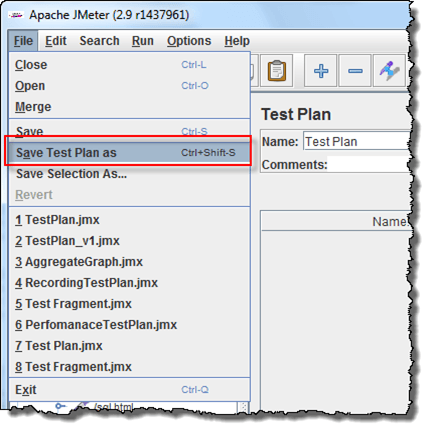
- A Dialog box display > enter a name of your test plan at File Name field > Click Save. Now your Test Plan is saved under name RecordingTestPlan.jmx
Step 3) Run your Test Plan
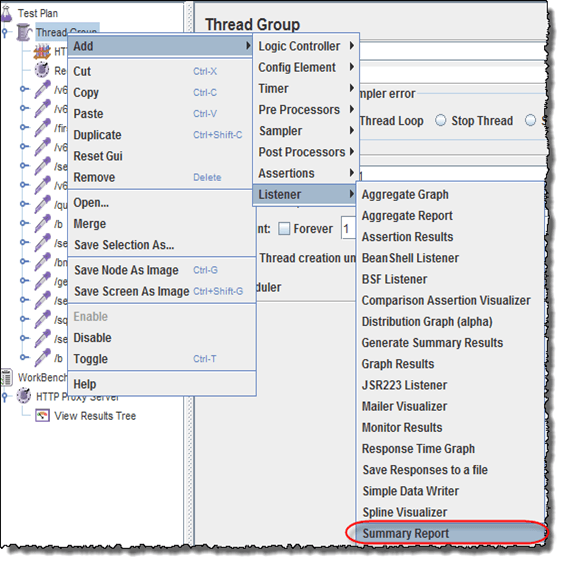
- Select Thread Group > Add > Listener > Summary Report
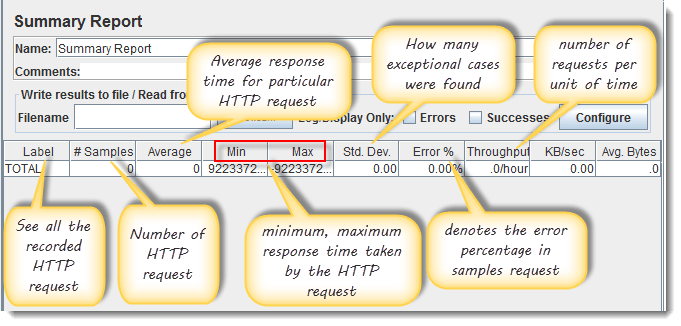
- The Summary Report will show some basic statics
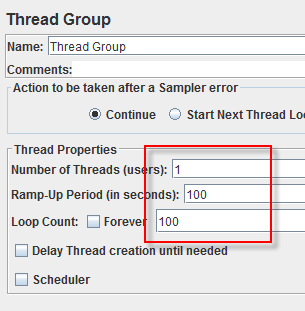
- Select Thread Group, enter information as the figure below
You can refer the article JMeter Performance Testing to know the detail about Thread Group configuring.
- Before you start the test, select “Summary Report”. When you ready to run a test, select Run > Start (Ctrl+R). JMeter will playback your activity in 100 times. As the test runs, the statistics will change until the test is done.
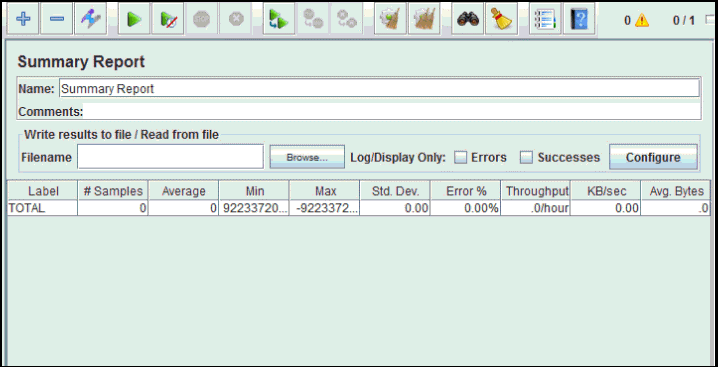
Step 4) Save your test result
- Click Save Table Data to save test result to file
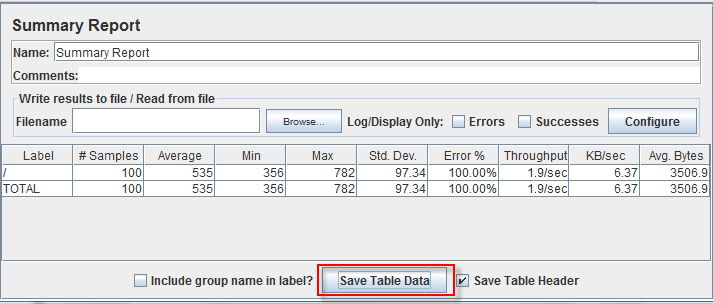
- Enter the name of the test result and click Save. Test Result in JMeter is saved in *.csv format as default

Download the File Recording Test Plan
Download the File HTTP Proxy Server
Recording HTTPS Traffic and Certificates
Almost every site now serves HTTPS, which the original walkthrough predates. A proxy cannot read encrypted traffic unless the browser trusts it, so one extra step is required.
When the recorder starts, JMeter generates a temporary root certificate named ApacheJMeterTemporaryRootCA.crt in its bin directory. Import that file into the browser as a trusted certificate authority, then restart the browser. JMeter can now present its own certificate for each site and decrypt the session for recording.
Three points are worth knowing:
- The certificate expires after seven days. This is deliberate. Delete it and let JMeter regenerate a fresh one rather than extending the validity.
- Remove it when finished. Leaving a trusted root certificate installed on a working machine is a genuine security risk, not a theoretical one.
- Some applications refuse it. Sites using certificate pinning or mutual TLS cannot be recorded through a proxy at all, and the script must be built by hand from browser developer tools instead.
Correlation: Making a Recorded Script Replayable
A recorded script reproduces exactly what happened once, which is rarely what happens the second time. Session identifiers, tokens, and generated keys captured during recording are dead values by the time the script is replayed, and the run fails in ways that look like application errors.
Correlation is the fix. A post-processor such as the Regular Expression Extractor or the JSON Extractor captures the fresh value from the login response, stores it in a variable, and later requests reference that variable instead of the recorded literal.
The workflow is short:
- Replay the script once with a View Results Tree listener and find the first failing request.
- Compare the failing request against the recording. Any value that differs between two runs needs correlating.
- Add an extractor to the response that produced the value, then replace the hardcoded literal with the variable reference.
- Add an assertion so a page returning HTTP 200 with an error message still fails the test.
Only after correlation is the script safe to scale up. Running an uncorrelated recording at a hundred users measures error handling rather than performance. Further elements are covered across the JMeter tutorials.
Troubleshooting
If you face an issue while running the above scenario, do the following:
- Check whether you are connecting to the internet via a proxy. If yes, remove the proxy.
- Open a new instance of JMeter.
- Open the RecordingTestPlan.jmx in JMeter.
- Right click on Workbench > Merge > Select HTTP Proxy Server.jmx. On JMeter 5.x, merge into the Test Plan node instead, since WorkBench no longer exists.
- Click on Thread Group > Summary Report.
- Run the Test.
Two further symptoms account for most remaining failures. If the browser reports that it cannot connect, the recorder was never started, or the port set in the browser does not match the port set in JMeter. If pages load normally but nothing appears in the tree, the traffic is HTTPS and the certificate has not been imported.
