
Requirements Analysis Techniques with Example
 Editorial Team
⚡ Smart Summary
Requirements analysis techniques help Business Analysts model workflows, communicate with stakeholders, and translate business needs into structured specifications using BPMN, UML, flowcharts, data flow diagrams, IDEF, Petri nets, and Gap Analysis.
As a Business Analyst, requirement analysis is the most important part of your job. It helps you determine the actual needs of stakeholders. It also lets you communicate with stakeholders using charts, models, and flowcharts instead of complex text.
A requirement analysis has a
- Specific Goal
- Specific Input
- Specific Output
- Uses resources
- Has a number of activities to be performed in some order
- May affect more than one organisational unit
- Creates value for the customer
Requirement Analysis Techniques
Requirement analysis techniques map the business workflow so you can analyse, understand, and improve it.
The following techniques are used across the software development process.
1. Business process modeling notation (BPMN)
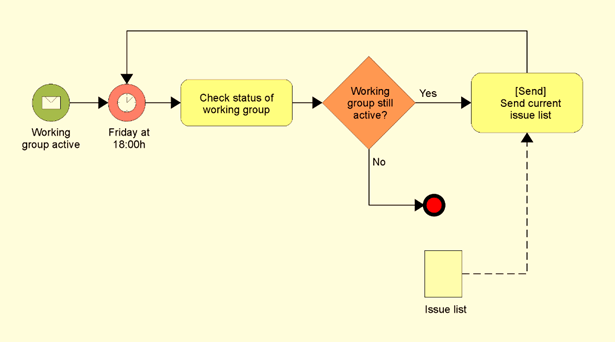
BPMN (Business Process Model and Notation) is a graphical representation of a business process using simple objects, which helps the organisation communicate in a standard manner. The main objects used in BPMN are:
- Flow objects
- Connecting objects
- Swim lanes
- Artifacts.
A well-designed BPMN model gives detail about the activities carried out during the process, such as:
- Who is performing these activities?
- What data elements are required for these activities?
The biggest benefit of BPMN is that diagrams are easy to share, and most modelling tools support the notation.
2. UML (Unified Modeling Language)
UML is a modelling standard for specifying, developing, visualising, and documenting software systems. UML provides objects such as:
- State
- Object
- Activity
- Class diagram
There are 14 UML diagram types, including use case, interaction, class, component, and sequence diagrams. UML models act as the medium of communication between all stakeholders. A UML-based business model can be a direct input to a requirements tool. A UML diagram is either behavioural or structural. A behavioural model describes what the system does; a structural model shows what it consists of.

3. Flow chart technique
A flowchart is a visual representation of the sequential flow and control logic of a set of related activities. Common flowchart formats include Linear, Top-down, and Cross-functional (swim lanes). A flowchart can be used to represent data flows, system interactions, and process steps. Flowcharts are easy to read and write, even for non-technical members, and can show parallel processes and critical attributes.

4. Data flow diagram
Data flow diagrams show how data is processed by a system in terms of inputs and outputs. The components of a data flow diagram are:
- Process
- Flow
- Store
- Terminator
A logical DFD shows activities; a physical DFD shows infrastructure. A DFD can be designed early in the analysis phase of the SDLC (System Development Life Cycle) to define the project scope. It can be drilled down into sub-processes, known as a “levelled DFD”.

5. Role Activity Diagrams (RAD)
A Role Activity Diagram is similar to flowchart notation. Role instances are process participants, each with a start and end state. RAD requires deep knowledge of the process or organisation to identify roles. The components of RAD are:
- Activities
- External events
- States

Roles group activities into units of responsibility. An activity may run in isolation or require coordination with activities in other roles.
External events mark the points where state changes occur.
States map how a role progresses through the process. Reaching a state indicates a specific goal is achieved.
RAD is easy to read, presents a detailed process view, and shows parallel activities.
6. Gantt Charts
A Gantt chart is a graphical representation of a schedule that helps to coordinate, plan and track specific tasks in a project. It shows the total project time span, broken into increments. The vertical axis lists tasks; the horizontal axis shows the estimated activity duration or assigned owner. A single chart can display many activities.

7. IDEF (Integrated Definition for Function Modeling)
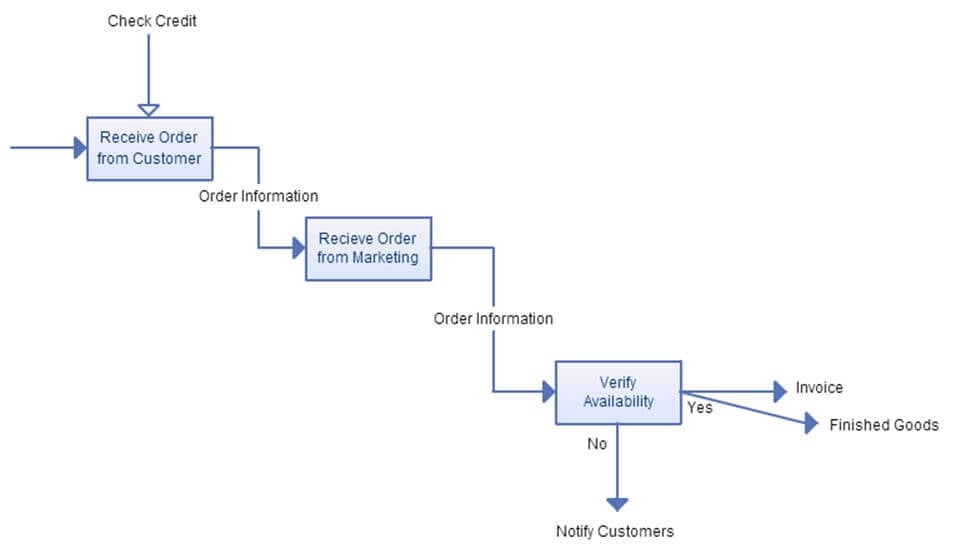
IDEF (Integrated Definition for Function Modeling) covers a family of enterprise modelling languages. It models the activities supporting system analysis, design, or integration. There are about 16 IDEF methods; IDEF0 and IDEF3 are the most useful.
8. Colored Petri Nets (CPN)
Coloured Petri Nets (CPN) are a graphically oriented language for the specification, verification, design, and simulation of systems. CPN combines graphics and text. Its main components are Places, Transitions, and Arcs.

Petri net objects have specific inscriptions, for example:
- Places: Has inscriptions such as .Name, .Color Set, and .Initial marking.
- Transition : Has inscriptions such as .Name (for identification) and .Guard (a Boolean expression over some of the variables).
- Arcs: Has an .Arc inscription. When the arc expression is evaluated, it yields a multi-set of token colours.
9. Workflow Technique
The workflow technique is a visual diagram that represents one or more business processes to clarify understanding or to make process-improvement recommendations. Alongside flowcharting, UML activity diagrams, and process maps, the workflow technique is one of the oldest and most widely used approaches. Business Analysts also use it for note-taking during requirements elicitation. The process comprises four stages:

- Information Gathering
- Workflow Modeling
- Business process Modeling
- Implementation, Verification & Execution
10. Object-Oriented Methods
The object-oriented modelling method uses the object-oriented paradigm and modelling language to design a system. It emphasises finding and describing the objects in the problem domain. The purpose of the object-oriented method is:
- To help characterise the system
- To identify the different relevant objects
- To understand how the objects relate to each other
- To specify or model a problem to create an effective design
- To analyse requirements and their implications
This method is well suited to systems with dynamic requirements that change frequently. It is a process of deriving use cases, activity flows, and event flows for the system. Object-oriented analysis can be driven by textual needs, communication with system stakeholders, and a vision document.
An object has a state, and state changes are represented by behaviour. When the object receives a message, the state changes through behaviour.
11. Gap Analysis
Gap Analysis is the technique used to determine the difference between the proposed state and the current state for a business and its functions. It answers questions such as: What is the current state of the project? Where do we want to be? How do we close the gap? The stages of Gap Analysis include:
- Review System
- Development Requirements
- Comparison
- Implications
- Recommendations
