SAP Monitoring & Performance Checks: Complete Tutorial with Tcodes
What is System Monitoring?
System monitoring is a daily routine activity and this document provides a systematic step by step procedure for Server Monitoring. It gives an overview of technical aspects and concepts for proactive system monitoring. Few of them are:
- Checking Application Servers.
- Monitoring System-wide Work Processes.
- Monitoring Work Processes for Individual Instances.
- Monitoring Lock Entries.
- CPU Utilization
- Available Space in Database.
- Monitoring Update Processes.
- Monitoring System Log.
- Buffer Statistics
Some others are:
- Monitoring Batch Jobs
- Spool Request Monitoring.
- Number of Print Requests
- ABAP Dump Analysis.
- Database Performance Monitor.
- Database Check.
- Monitoring Application Users.
Why Daily Basic checks / System Monitoring?
How do we do monitor a SAP System?
Checking Application Servers (SM51)
This transaction is used to check all active application servers.
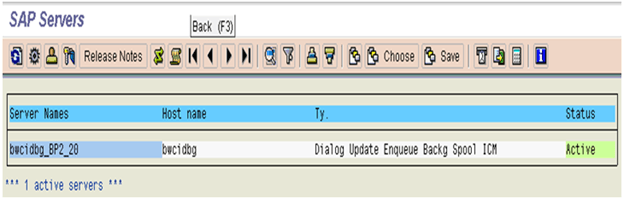
Here you can see which services or work processes are configured in each instance.
Monitoring Work Processes for Individual Instances SM50
Displays all running, waiting, stopped and PRIV processes related to a particular instance. Under this step we check all the processes; the process status should always be waiting or running. If any process is having a status other than waiting or running we need to check that particular process and report accordingly.
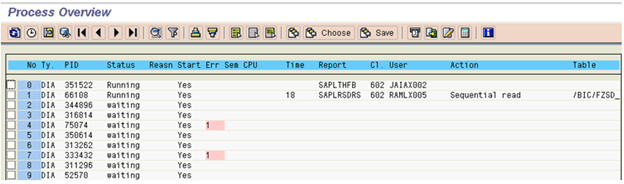
This transaction displays a lot of information like:
- Status of Work process (whether it’s occupied or not)
- If the work process is running, you may be able to see the action taken by it in the Action column.
- You can which table is being worked upon
Some of the typical problems:
- The user takes a long time to log on/not able to logon/online transaction very slow. This could be the result of the DIA work processes are fully utilized. There could be also the result of long running jobs (red indicator under the Time column). If necessary you can cancel the session by selecting the jobs then go to Process>Cancel Without core. This will cancel the job and release the work process for other user/process
- Some users may have PRIV status under Reason column. This could be that the user transaction is so big that it requires more memory. When this happen the DIA work process will be ‘owned’ by the user and will not let other users use. If this happens, check with the user and if possible run the job as a background job.
- If there is a long print job on SPO work process, investigate the problem. It could be a problem related to the print server or printer.
Monitoring System-wide Work Processes (SM66)
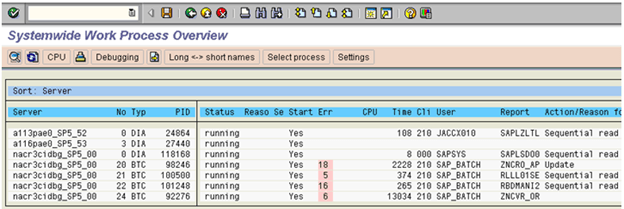
By checking the work process load using the global work process overview, we can quickly investigate the potential cause of a system performance problem.
Monitor the work process load on all active instances across the system
Using the Global Work Process Overview screen, we can see at a glance:
- The status of each application server
- The reason why it is not running
- Whether it has been restarted
- The CPU and request run time
- The user who has logged on and the client that they logged on to
- The report that is running
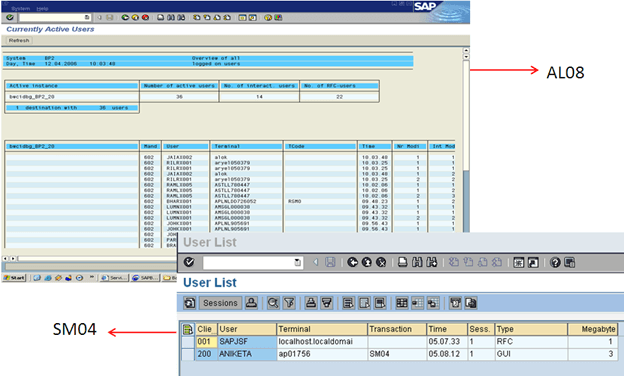
Monitor Application User (AL08 and SM04)
This transaction displays all the users of active instances.
Monitoring Update Processes (SM13)
Execute Transaction SM13 and put ‘*‘ in the field USER and click on ![]() button.
button.
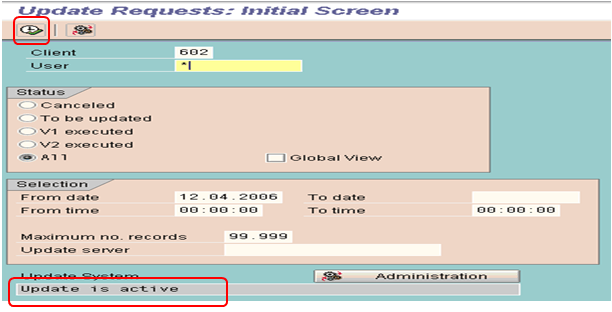
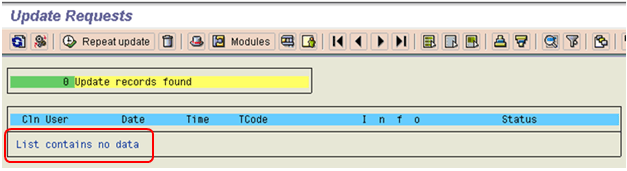
If there are no long pending updates records or no updates are going on then this queue will be empty as shown in the below screen shot.
But, if the Update is not active then find the below information:
- Is the update active, if not, was it deactivated by the system or by a user?
- Click on
 button and get the information.
- Click on
 button and get the below information:
- Click on
- Is any update cancelled?
- Is there a long queue of pending updates older than 10 minutes?
Monitoring Lock Entries (SM12)
Execute Transaction SM12 and put ‘*’ in the field User Name
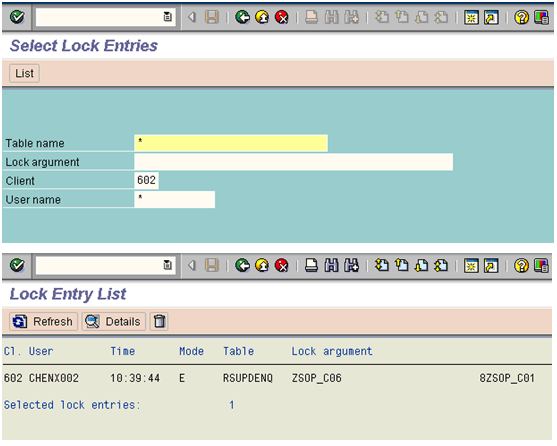
SAP provides a locking mechanism to prevent other users from changing the record that you are working on. In some situations, locks are not released. This could happen if the users are cut off i.e. due to network problem before they are able to release the lock.
These old locks need to be cleared or it could prevent access or changes to the records.
We can use lock statistics to monitor the locks that are set in the system. We record only those lock entries which are having date time stamp of the previous day.
Monitoring System Log (SM21)
We can use the log to pinpoint and rectify errors occurring in the system and its environment.
We check the log for the previous day with the following selection/option:
- Enter Date and time.
- Select Radio Button Problems and Warnings
- Press Reread System Log.

Tune Summary (ST02)
Step 1: Go to ST02 to check the Tune summary.
Step 2: If you see any red values, in SWAPS, double –click the same.

Step 3: In the below screen click on the tab ‘Current Parameters’

Step 4: Note down the value and the Profile parameters

Step 5: Go to RZ10 (to change the Profile parameter values)
Step 6: Save the changes.
Step 7: Restart the server to take the new changes effect.
CPU Utilization (ST06)

Idle CPU utilization rate must be 60-65%, if it exceeds the value then we must start checking at least below things:
- Run OS level commands – top and check which processes are taking most resources.
- Go to SM50 or SM66. Check for any long running jobs or any long update queries being run.
- Go to SM12 and check lock entries
- Go to SM13 and check Update active status.
- Check for the errors in SM21.
ABAP Dumps (ST22)
Here we check for previous day’s dumps

Spool Request Monitoring (SP01)
For spool request monitoring, execute SP01 and select as below:
- Put ‘*’ in the field Created By
- Click on
 execute button.

Here we record only those requests which are terminated with problems.

Monitoring Batch Jobs (SM37)
For Monitoring background jobs, execute SM37 and select as below:
- Put ‘*’ in the field User Name and Job name
- In Job status, select: Scheduled, Cancelled, Released and Finished requests.

Transactional RFC Administration (SM58)
Transactional RFC (tRFC, also originally known as asynchronous RFC) is an asynchronous communication method which executes the called function module in the RFC server only once.

We need to select the display period for which we want to view the tRFCs and then select ‘*’ in the username field to view all the calls which have not be executed correctly or waiting in the queue.
QRFC Administration (Outbound Queue-SMQ1)
We should specify the client name over here and see if there any outgoing qRFCs in waiting or error state.

QRFC Administration (Inbound Queue-SMQ2)

We should specify the client name over here and see if there any incoming qRFCs in waiting or error state.
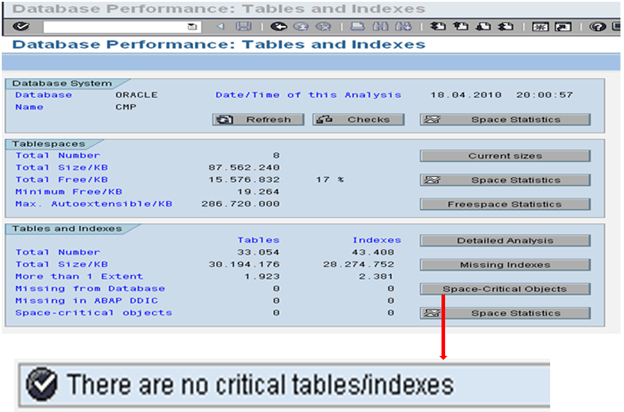
Database Administration (DB02)
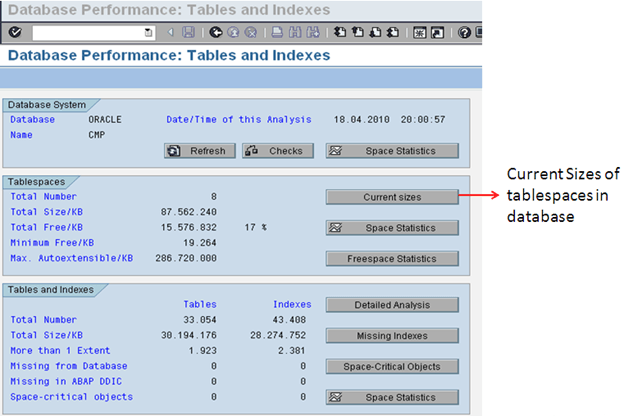
After you select Current Sizes on the first screen we come to the below screen which shows us the current status of all the tablespaces in the system.

If any of the tablespaces is more than 95% and the auto extent is off then we need to add a new datafile so that the database is not full.
We can also determine the history of tablespaces.
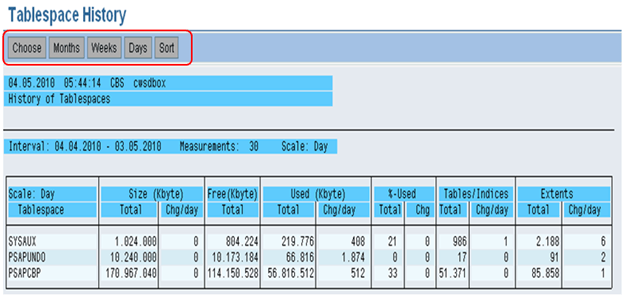
We can select Months, Weeks or Days over here to see the changes which take place in a tablespace.
We can determine the growth of tablespace by analyzing these values.

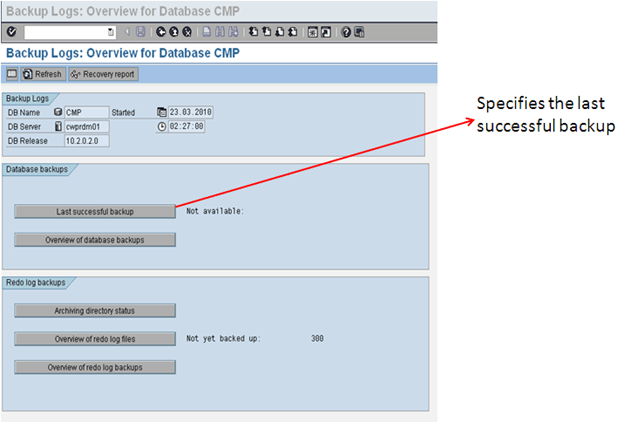
Database Backup logs (DB12)
From this transaction, we could determine when the last successful backup of the system was. We can review the previous day’s backups and see if everything was fine or not.
We can also review the redo log files and see whether redo log backup was successful or not.
Quick Review
Daily Monitoring Tasks
- Critical tasks
- SAP System
- Database
Critical tasks
| No | Task | Transaction | Procedure / Remark |
|---|---|---|---|
| 1 | Check that the R/3System is up. | Log onto the R/3 System | |
| 2 | Check that daily backup executed without errors | DB12 | Check database backup. |
SAP System
| No | Task | Transaction | Procedure / Remark |
|---|---|---|---|
| 1 | Check that all application servers are up. | SM51 | Check that all servers are up. |
| 2 | Check work processes (started from SM51). | SM50 | All work processes with a “running” or a “waiting” status |
| 3 | Global Work Process overview | SM66 | Check no work process is running more than 1800 second |
| 3 | Look for any failed updates (update terminates). | SM13 |
|
| 4 | Check system log. | SM21 | Set date and time to before the last log review. Check for:
|
| 5 | Review for canceled jobs. | SM37 | Enter an asterisk (*) in User ID. Verify that all critical jobs were successful. |
| 6 | Check for “old” locks. | SM12 | Enter an asterisk (*) for the user ID. |
| 7 | Check for users on the system. | SM04AL08 | Review for an unknown or different user ID and terminal. This task should be done several times a day. |
| 8 | Check for spool problems. | SP01 | Enter an asterisk (*) for Created ByLook for spool jobs that have been “In process” for over an hour. |
| 9 | Check job log | SM37 | Check for:
|
| 10 | Review and resolve dumps. | ST22 | Look for an excessive number of dumps. Look for dumps of an unusual nature. |
| 11 | Review buffer statistics. | ST02 | Look for swaps. |
Database
| No | Task | Transaction | Procedure / Remark |
|---|---|---|---|
| 1 | Review error log for problems. | ST04 | |
| 2 | Database Growth Missing Indexes | DB02 | If tablespace is used more than 90 % add new data file to it Rebuild the Missing Indexes |
| 3 | Database Statistics log | DB13 |