10 BEST TradingView Alternative (2026)

Have you ever tried to make sense of trading platforms only to end up frustrated with hidden rules, slow payouts, or data delays that wreck your timing? Many tools trap users with slippage on trades, scaling limitations, or unfair resets that erase hard work. Worse, using false methods or unreliable software often leads to chasing bad signals and wasting capital. Poor setups create stress and doubt, while the right TradingView alternatives offer clarity, efficiency, and confidence to grow steadily in fast-moving markets.
I invested 166+ hours researching and testing 19 tools to uncover the best TradingView alternatives. Every insight comes from firsthand, hands-on experience, carefully backed-by verified testing. In this guide, I cover key features, pros/cons, and pricing to simplify your decision. Read the full article to find the tool that suits you best. Read more…
TrendSpider is an all-in-one market research and trading platform built for active traders across stocks, ETFs, options, futures, forex, and crypto. It brings research, charting, scanning, backtesting, alerting, and automation into a single workflow — with AI assistance via Sidekick and machine-learning strategy training via AI Strategy Lab.
Best TradingView Alternatives for Equity, Crypto & Forex: Free & Paid!
| Name | Free Trial | Mobile App | Link |
|---|---|---|---|
👍 TrendSpider |
14 Days Free Trial | Yes | Learn More |
 GoCharting |
Lifetime Free Basic Plan | Yes | Learn More |
Pionex |
Lifetime Free | Yes | Learn More |
Cryptohopper |
Lifetime Free Basic Plan | Yes | Learn More |
 Barchart |
30 Days Free Trial | Yes | Learn More |
1) TrendSpider
TrendSpider is an all-in-one market research and trading platform for active traders across stocks, ETFs, options, futures, forex, and crypto. The core workflow runs in one place — research, chart, scan, backtest, alert, and automate — and it layers AI on top through Sidekick, the AI Strategy Lab, and an AI Coding Assistant that builds custom JavaScript indicators from plain-English prompts.
I valued how the platform consolidates real-time market data across asset classes alongside automated technical analysis tools like trendline detection, Fibonacci detection, support/resistance detection, and Raindrop Charts. With compatibility across Windows, Android, iPhone, and Web, I stayed connected without missing key setups.
Supported Platforms: Windows, Android, iPhone, Web.
Free: First 14 Days Free
Support: Phone, E-mail & Chat
Use Code GURU25 to get 25% off for 12 months
Features:
- Advanced Charting & Technical Analysis: This feature combines 400+ indicators with automated trendline detection, automated Fibonacci detection, automated support/resistance detection, and multi-timeframe analysis. Chart types include line, candlestick, and TrendSpider’s signature Raindrop Charts, which visualize volume flow within each candle. I’ve used it to spot trend shifts and key levels faster than manual chart drawing allows.
- Custom & AI-Generated Indicators: You can code your own indicators in JavaScript or describe what you want in plain English and let the AI Coding Assistant generate the code. Custom indicators work everywhere on the platform — charts, scanners, alerts, strategies, and bots — so anything you build is reusable across your full workflow.
- Sidekick AI Market Analyst: Sidekick is TrendSpider’s purpose-built trading AI. It can read your charts, access TrendSpider’s data, build and refine scans, manage alerts, compare watchlists, review backtest results, and generate custom JavaScript indicators from natural-language prompts. I’ve used it as an always-on research assistant that turns ideas into platform actions in seconds.
- Multi-Asset Market Data: Real-time market data is included for US stocks, ETFs, forex, futures, and cryptocurrencies on non-professional accounts, with broad asset coverage across the platform. (Note: the older “150 crypto exchanges / 6,500 trading pairs” figure is no longer reflected on TrendSpider’s current product pages and has been removed to avoid stale numbers.)
- Strategy Bots & Forward Testing: Once a strategy is tested, Strategy Bots deploy it forward as bi-directional, position-aware alerts or as a fully automated bot for forward testing and supported order-routing workflows. Bots stay online until you stop them and trigger the moment your conditions occur.
- Platform Compatibility: TrendSpider runs on Windows, macOS, iOS, Android, and any modern web browser, with a Chrome extension for chart pop-ups while browsing the web. I’ve relied on it across desktop and mobile, and the experience stays consistent.
- Pricing & Plans: TrendSpider offers four individual plans — Standard, Premium, Enhanced, and Advanced — each with full access to every tool. Plans differ on usage limits (alerts, bots, workspaces, scan capacity, backtesting depth, and shortest available timeframe). Monthly, quarterly, and annual billing are available; annual billing offers the largest discount. The 14-day paid trial is available at $19 (Standard), $29 (Premium), $39 (Enhanced), or $49 (Advanced).
Use Code GURU25 to get 25% off for 12 months
2) GoCharting
GoCharting offers real-time crypto and equity analysis with a lifetime free basic plan that includes over 300 indicators. I valued its ability to embed live trading directly into the charts, giving me instant feedback while monitoring depth through price ladders and DOM charts. Sales-time alerts and flexible chart layouts across multiple screens made it stand out for me as a serious TradingView alternative with practical depth-oriented tools.
On X, @gocharting highlighted new Rithmic integration for CME markets, opening opportunities for futures traders in gold and S&P contracts. This update signals its push toward becoming a multi-asset platform, bridging crypto and traditional futures trading for more advanced strategy execution.

Features:
- Technical Indicators and Tools: This feature offers over 150 built-in indicators and drawing tools, but I’d emphasize flexibility. You can layer multiple indicators, tweak settings, and save custom templates. In my experience, this speeds up repeat analysis and builds consistency.
- Chart Layouts and Multi-Monitor: GoCharting lets you create multi-chart layouts across several monitors. This setup is powerful for comparing correlated assets or cross-market signals. I often keep crypto, forex, and equity charts side-by-side to spot divergences quickly.
- Time of Sale with Alerts: The platform provides time-of-sale data and customizable alerts. You can filter alerts by volume spikes, block trades, or unusual price movements. I’ve used these triggers as early signals for liquidity shifts before major breakouts.
- DOM Charts and Price Ladders: Depth-of-market charts and price ladders are included. They help track resting orders and order book imbalances in real time. I usually rely on this during volatile sessions where liquidity pockets matter more than static charts.
- Backtesting and Strategy Builder: It would be great if GoCharting included native backtesting tools. Traders could simulate historical performance using indicators, reducing guesswork. Testing strategies before going live can help avoid costly mistakes.
Lifetime Free Basic Plan
| Platform | Your Cost ($) | vs TradingView |
|---|
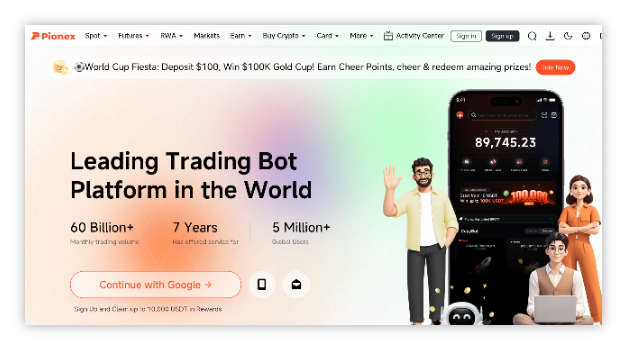
3) Pionex
Pionex is the TradingView alternative I reach for when I want charts and automation living in the same window. It ships 16 free built-in trading bots, so a setup I spotted on the chart could be turned into a running Grid or DCA strategy without writing a single line of code. I also valued that its trading fee sits at a flat 0.05%, one of the lowest I have paid on any major exchange, while the charts, the bot, and the order book all stay on one screen.
What makes it a real alternative rather than just another exchange is the depth of its automation. Its Rebalancing Bot keeps my asset mix on target, and the Spot-Futures Arbitrage Bot runs a low-risk, market-neutral strategy that harvests the gap between spot and futures prices. For traders who care more about executing a strategy than about drawing on a chart, that combination quietly replaces both a charting subscription and a separate bot service.
Features:
- 16 Free Built-In Trading Bots: You get Grid Trading, Rebalancing, Martingale, DCA, and Infinity Grid bots included at no extra cost. I ran a Grid Bot on a ranging BTC pair while I kept analysing other charts, and it worked the range without me watching it.
- Smart Trade Terminal: This terminal lets you set a stop-loss, a take-profit, and a trailing stop inside one trade ticket. In my experience it removes the messy juggling of separate orders that a pure charting tool always pushes back to your broker.
- Spot-Futures Arbitrage Bot: The bot captures the funding-rate gap between spot and futures markets in a market-neutral way. I used it as a passive income leg while my directional charts stayed flat, and it is the closest thing to a hands-off strategy here.
- Low 0.05% Trading Fee: Pionex charges a flat 0.05% on spot trades, which undercuts most major exchanges. Across a month of frequent rebalancing, I noticed the fee drag was far smaller than what I had been paying elsewhere.
- API Access and Mobile App: You can build custom strategies through the API or manage running bots from the mobile app. I have restarted a stalled grid from my phone mid-session, and that is something a charting platform simply cannot do
Lifetime Free
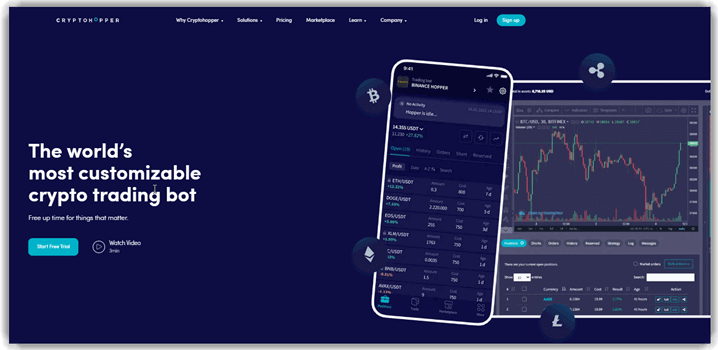
4) Cryptohopper
Cryptohopper is the cloud-based automation layer I pair with charting when alerts alone are not enough. Its Strategy Designer handed me 130+ indicators and candle patterns to build rules with, and I could wire up 17 exchanges, including Binance, Coinbase Advanced, and Kraken, from a single dashboard. I liked most that the bot keeps running in the cloud long after I have closed the laptop.
The part that matters most to TradingView users is the direct signal integration. I can fire a webhook from a TradingView alert and let Cryptohopper execute the trade on my exchange, so the analysis stays where I am comfortable and the execution moves to a bot. Add backtesting, paper trading, and a marketplace of ready-made strategies, and chart study turns into filled orders instead of manual clicks.
Features:
- Strategy Designer: You can combine 130+ indicators and candle patterns into your own rule set without touching code. I rebuilt a charting script as a Cryptohopper strategy in an afternoon, and the visual editor made the logic far easier to audit.
- TradingView Signal Integration: The platform accepts signals straight from TradingView alerts and executes them on your connected exchange. This is exactly what I use when I want to keep charting where I am comfortable but hand execution to a bot.
- Backtesting and Paper Trading: You can test a strategy against historical data, then run it on paper before risking real capital. I always burn a week on paper first, and it has saved me from shipping more than one over-fitted setup
- Mirror and Copy Trading: The marketplace lets you follow proven signallers or mirror another trader’s bot. I treat it as a benchmark, comparing my own equity curve against a well-rated hopper before I scale a strategy up.
- Advanced Risk Management: Stop-loss, trailing stop-loss, and position sizing are configurable per bot. I set trailing stops on every position so profits lock in automatically when the market turns, instead of relying on me being at the screen.
Lifetime Free Basic Plan
5) Barchart
Barchart provides real-time market data, charting, and streamlined trade execution. I valued how it allowed me to place trades directly within the platform, which simplified my workflow significantly. The customizable charts, complete with interactive studies and drawing tools, made technical analysis far more intuitive. Access to both real-time options pricing and historical data helped me track market trends and act decisively. With a 30-day free trial, it stands out as an accessible yet powerful TradingView alternative for active traders.
On its official X handle @Barchart, recent posts highlight how 62% of S&P 500 stocks are above their 200-day moving average, and hedge funds are building record short positions in small caps. These insights underscore its value as a go-to hub for timely market sentiment and positioning trends.

Features:
- Interactive Charts: This feature gives you advanced, customizable real-time charts with overlaid technical studies. You can fine-tune indicators, apply multiple timeframes, and save templates for different trading setups. It’s especially powerful for spotting trends across assets quickly.
- Simple UI: You can navigate easily with drag-and-drop panels and flexible layouts. I’ve used this across multiple monitors, and it’s seamless for multitasking. It keeps your trading desk organized, which really reduces cognitive overload.
- Real-Time Options Pricing: This feature provides accurate live options pricing directly from market feeds. It lets you monitor volatility shifts and Greeks instantly. As a trader, I’ve found this critical when adjusting strategies intraday.
- Historical Trading Data: You can access deep historical data, including price, volume, and options activity. This helps backtest strategies more realistically. I’ve used this when validating setups over years of past market behavior.
- Advanced Screener Integration: You can filter stocks, ETFs, and options with customizable criteria. It’s helpful when you need to quickly identify opportunities by fundamentals, volatility, or technical triggers.
30-Days Free Trial
6) SeekingAlpha
SeekingAlpha delivers robust tools for charting and trade analysis, making it a go-to alternative for those who want data-driven confidence. I liked how it provides structured trade setups with targets, support levels, and stop losses. With its lifetime free basic plan, I could also dive into expert research, spanning stock ideas, IPO reviews, and strategic market outlooks. The simple design and depth of insights gave me a clearer path to potential profits.
Their X account, @SeekingAlpha, actively shares market commentary—recent posts covered Tesla’s breakout potential and sector-specific risks. I see this as an extension of the platform’s value, offering investors fast-moving updates to complement deeper portfolio strategies.

Features:
- Chart Confidence: This feature gives you structured, data-backed charts with multiple overlays. It allows you to confirm your trading bias with confidence. I often compare chart structures here with my own analysis to reduce blind spots.
- Trade Set-Ups: You can access curated trade setups with price targets, risk levels, and stop-loss markers. It helps you systematize entries and exits. I’ve used these to validate short-term plays and manage downside risks effectively.
- Data Insights: This feature distills raw market data into actionable insights. It helps you track sector flows, valuation signals, and momentum shifts. Having it alongside my technical models provides a much clearer macro-to-micro perspective.
- Stock Analysis: SeekingAlpha provides deep dives on stock fundamentals and sentiment. It covers earnings, market outlooks, IPO reviews, and investing ideas. I found it useful to benchmark my thesis against professional and crowd-sourced analysis.
- Earnings Call Transcripts: You can read and analyze full earnings call transcripts directly on the platform. This helps you catch tone, guidance changes, and management sentiment shifts that often precede price action.
Lifetime Free Basic Plan
7) Protrader
Protrader is a professional-grade platform designed to serve institutions and active retail traders alike. I appreciated how it combined comprehensive access to forex, options, CFDs, and futures into one environment. Its tailored tools for scalping and day trading noticeably improved my speed of decision-making. The visual trading interface also simplified chart analysis, making it easier to spot opportunities in volatile markets. I felt its flexibility across web, desktop, Mac, and Android strengthened my workflow.
Recently, @protrader_com highlighted product enhancements that strengthen multi-asset trading coverage and improve execution efficiency. Such updates align well with the needs of algorithmic traders who rely on both speed and reliability when navigating high-volume sessions.

Features:
- Trading Environment: This feature offers a multi-asset environment covering forex, options, CFDs, stocks, and futures. You can trade across different markets in one place. It reduces switching costs and improves focus. I found it convenient for portfolio diversification.
- Day Trading Tools: It provides specialized tools for scalping and intraday setups. These are built with speed, precision, and risk control in mind. I have personally used such features to refine entries. They significantly cut decision lag in volatile markets.
- Visual Trading: This feature includes advanced charting with direct order placement. You can drag, drop, and modify trades visually on the chart. It improves order accuracy while reducing input errors. I find it especially useful during fast-moving conditions.
- Platform Support: Protrader works seamlessly on Desktop, Web, Mac, and Android. You can trade anywhere with synchronized access. The cross-platform continuity saves time when switching devices. It makes the platform versatile for both professional and casual traders.
- Broker Connectivity: It offers plug-and-play connectivity to multiple brokers, enhancing execution flexibility. You can route trades to preferred liquidity providers. This reduces spreads and slippage. I often rely on such setups to capture tighter fills in volatile pairs.
Link: https://protrader.com/
8) StockCharts
StockCharts delivers powerful charting resources, technical tools, and expert analysis that make tracking and forecasting market moves more effective. When I tested it, I valued the in-depth analytics that made complex data easier to understand and act upon. Its portfolio tracking with ChartLists and support across multiple devices ensured I could monitor markets seamlessly. This makes StockCharts a well-rounded TradingView alternative for both active traders and investors.
StockCharts focuses on equity technical analysis with a clean interface. When I evaluated it, the indicator library covered the classic technical analysis toolkit comprehensively, and the ChartLists feature helped organize watchlists by strategy without clutter.

Features:
- Market Success Resources: ChartLists organization for saved watchlists and annotated charts, useful for strategy-based grouping.
- Technical Tools Availability: StockCharts provides advanced charting indicators, overlays, and drawing resources directly at your fingertips. It is designed for serious traders who need precision. I often used these tools to validate setups before entering trades.
- Portfolio Monitoring: You can track portfolios with dynamic ChartLists, making position management much easier. It lets you organize watchlists, open trades, and strategies in one place. This improves clarity and helps you act faster when markets move.
- Backtesting Capabilities: This feature would let you test trading strategies against historical market data. It helps validate whether setups or indicators consistently worked before risking real money. I’ve relied on backtesting to refine rules and improve win rates.
- Customizable Workspaces: A customizable workspace allows you to save personalized layouts for charts, tools, and lists. You can create different views for swing trading, scalping, or long-term investing. It streamlines analysis and improves trading focus.
Link: https://stockcharts.com/
9) Tab-trader
Tab-Trader is a crypto trading terminal that aggregates 20 000+ trading pairs across 20+ major exchanges, lets you chart, set alerts, and execute orders—all in one unified interface. It offers a free version, and when I started using it I appreciated how quickly I could link multiple exchanges and track assets without hopping between apps.
On its official X handle @tabtraderpro, the team recently teased new features and cross-platform updates—this hints they are pushing deeper into desktop/web support and tighter integration across devices.

Features:
- Chart Creation: This feature lets you build charts quickly with trendlines, horizontal levels, and technical indicators. I like how it allows on-the-go adjustments. For better precision, layering multiple indicators would make analysis more reliable.
- Trading Accessibility: You can keep all trading instruments in your pocket. This feature is useful for executing trades instantly while away from your desk. I have used it to capture sudden moves in volatile crypto pairs.
- Unified Interface: This feature combines account tracking, charting, and trade execution in one clean interface. It reduces friction for mobile-first traders. I find this all-in-one flow especially helpful during high-volatility trading sessions.
- API Connectivity: You can connect accounts directly through secure exchange APIs for faster trades. This reduces lag and avoids manual input delays. I’ve seen how API trading helps minimize slippage in volatile order books.
- Portfolio Analytics: This feature provides a dashboard showing PnL, risk exposure, and allocations. It helps you track overall performance across exchanges. I use similar tools to avoid overexposure to one coin during strong market swings.
Link: https://tab-trader.com/
10) MetaTrader
MetaTrader is a multi-asset trading platform for Forex, stocks, and futures. I have used it during volatility and respected its operational stability. It offers technical and fundamental analysis tools for disciplined decision-making. The layout keeps research, charting, and execution organized and efficient. The platform suits traders seeking structure, clarity, and strategy enhancement today.
On X, @MetaQuotes_News recently spotlighted new MT5 build enhancements publicly. They also promoted upcoming expos, showing active outreach and development cadence. I track such updates to schedule platform changes intentionally well. That steadies systems before highly volatile crypto sessions for me.

Features:
- Charting Capabilities: This feature lets you open unlimited charts with 21 unique timeframes. You can drill into one-minute scalps or zoom out for weekly setups. I’ve used this flexibility to fine-tune entries and track multi-timeframe confluence.
- Technical Indicators: MetaTrader provides more than 80 built-in technical indicators for analysis. You can apply moving averages, oscillators, and custom add-ons. I find these particularly useful when backtesting strategies before committing real capital.
- Fundamental Analysis: It integrates real-time financial news and an economic calendar. This feature helps track macro events impacting Forex and equities. You can quickly align trading decisions with central bank releases or corporate updates.
- Copy Trading: This copy trading platform allows automatic replication of trades from experienced professionals. It’s ideal for newcomers learning through observation. I’ve seen traders build confidence by shadowing veterans before transitioning to independent execution.
- Multi-Asset Access: MetaTrader isn’t limited to Forex; it extends to stocks, indices, and commodities. You can diversify portfolios and hedge across asset classes. This feature makes it a one-stop platform for global traders.
Link: https://www.metatrader4.com/en
What is TradingView? Why look for a TradingView Alternative?
TradingView is an online stock-picking application and screener for both beginners and experienced active traders. It allows you to combine different types of cloud-based charting tools for research. This application also provides the ability to share and collaborate with other online traders.
Traders often explore TradingView alternatives to overcome specific limitations. Some platforms offer cheaper pricing, while others provide advanced backtesting, faster execution, or unique crypto features. Many alternatives allow deeper market data integration or support for multiple brokers and exchanges that TradingView may not cover. Others focus on mobile-first experiences, ideal for active day traders. Choosing the right alternative depends on your trading style, preferred markets, and budget. By comparing these factors, you can find tools that better fit your trading needs.
How do you read a stock chart?
Here are some basic tips which will help you to read stock charts:
- Observe the Price and Time Axes: I suggest observing the price of your chart and time axes to analyze the stock or crypto you want to examine.
- Look for the trend line: You should look for the trend line and see whether it is up or down, and according to the chart position, you must create your strategy.
- Identify Trading Volume: Trading volume is another key factor to look at when reading a stock chart.
- Identify Lines of Support and Resistance: I also recommend examining a stock chart with support lines and their resistance.
What Russian-Speaking Traders Actually Need From A Charting Platform
Russian-speaking traders usually need four things from a charting platform: deep technical indicators, reliable real-time data for the instruments they trade, a scripting layer for custom strategies, and connectivity to the broker they use. TradingView covers three of those four out of the box, but broker integration and MOEX data quality are the areas where alternatives compete most effectively.
For MOEX-listed equities and futures, platforms with direct exchange data feeds often beat general-purpose tools. For FX and CFDs, MetaTrader remains dominant with most Russian-speaking brokers. Choosing an alternative comes down to matching the platform’s strengths to the instruments and broker the trader actually uses.
How To Evaluate A TradingView Alternative Step By Step
Evaluating a charting platform takes a short structured test. This is the routine I follow when testing a TradingView alternative for a Russian-speaking trader.
- List the instruments you actually trade: MOEX equities, futures, major FX pairs, specific crypto pairs. Confirm the platform has reliable data for each.
- Check the charting feature set: indicators, drawing tools, multiple timeframes, linked charts, and saveable workspaces.
- Review the scripting environment. Pine Script on TradingView is the benchmark; alternatives vary widely, and the import path from Pine often matters if you already own strategies.
- Test broker connectivity. The alternative should connect to your broker directly or through a documented API. Manual trading from the chart is a big productivity gain.
- Check real-time data pricing. Some platforms charge extra for MOEX, US equities, or specific futures; cost can add up quickly.
- Read the terms on data export. Traders often need to export chart data for audit, journal, or research; a locked platform becomes a risk over time.
- Verify mobile and desktop parity. The platform should not force you to choose between a good desktop experience and a usable phone app.
- Run the platform for a short evaluation across typical trading sessions before moving over fully. A full Europe/Moscow session and a US session together expose most issues.
This routine keeps the evaluation grounded in the trader’s real workflow rather than feature checklists.
Why TradingView Remains The Benchmark But Not Always The Right Choice
TradingView is the benchmark because it combines a strong charting UI, deep indicator library, active community, and Pine Script in a single cross-instrument platform. For most retail traders, it is hard to beat on pure charting experience.
It is not always the right choice, though, for three reasons. Instrument-specific platforms often offer cleaner data for the instruments they specialize in. MetaTrader and similar broker-bundled platforms connect directly to execution in ways TradingView sometimes cannot. And for frequent automated strategies, local desktop platforms provide lower latency than a cloud-first product. Picking an alternative is less about beating TradingView overall and more about matching the trader’s specific instruments, broker, and automation needs.
Verdict
After a thorough review of all the TradingView alternatives, I have come to the conclusion that the following three sites offer the best trading tools. These three platforms are my top recommendation, and here’s why:
- TrendSpider: It provides a top-notch experience with its customizable, user-friendly charting tools that cater to crypto and forex traders.
- GoCharting: This TradingView alternative provides DOM charts and price ladders, hence allowing me to pay attention to market depth effectively.
- Pionex: Pionex gave me 16 built-in trading bots and a flat 0.05% fee, letting me automate crypto strategies without paying for a separate charting subscription.
FAQs
TrendSpider is an all-in-one market research and trading platform built for active traders across stocks, ETFs, options, futures, forex, and crypto. It brings research, charting, scanning, backtesting, alerting, and automation into a single workflow — with AI assistance via Sidekick and machine-learning strategy training via AI Strategy Lab.