9 Best FREE Microsoft Visio Alternatives (2026)
A striking diagram can simplify the most sophisticated concepts and unite entire teams. Choosing the right diagramming tool is vital for professionals who demand efficiency without compromise. With over 30 years analyzing SaaS solutions, I crafted this guide on the Best FREE Microsoft Visio Alternatives to help you overcome Microsoft Visio’s mobile and Mac constraints and foster seamless teamwork. The current surge in cloud-based design highlights a shift toward smarter, integrated workflows.
After dedicating over 100 hours to thoroughly test 40+ tools, I assembled this must-see, honest guide to the Best FREE Microsoft Visio Alternatives, covering both free and paid options. While using one platform, I admired its intuitive design and robust collaboration features. My transparent breakdown of each tool’s features, pros and cons, and pricing provides a comprehensive, well-researched, and trusted resource for anyone looking for a reliable Microsoft Visio Alternative. Read more…
Miro is a collaborative online whiteboard with over 1,000 templates including mind maps, Kanban boards, Gantt charts, product wireframes, research boards, and flowcharts.
Best Microsoft Visio Alternatives Online: Top Software
| Name | platform | Free Trial | Link |
|---|---|---|---|
👍 Miro |
Windows, MacOS, iOS, and Android | Life Time Free Basic Plan | Learn more |
👍 Edraw Max |
Windows, macOS, and Linux | 7 Days Free Trial | Learn more |
Visme |
Windows, Mac | Lifetime Free Basic Plan | Learn more |
Creately |
Windows, macOS, and Linux | Lifetime Free Basic Plan | Learn more |
Visor |
Windows, iOS, and Android | Lifetime Free Basic Plan | Learn more |
1) Miro
Miro brings a powerful and engaging approach to visual collaboration. I tested this collaborative online whiteboard and noticed it is one of the easiest ways to connect cross-functional teams and streamline complex workflows. The variety of templates, from Kanban to Gantt charts, helps you plan and execute ideas with precision. I particularly liked how it supports 300 editors at once, making it ideal for larger organizations or fast-moving projects. Its intuitive communication tools, like @mentions and built-in video, make sure you do not miss a detail. These days, product designers often use this feature to co-create wireframes and get instant feedback, showcasing how Miro empowers innovation.
Drag and drop editor: Yes
Offline access: Yes
Supported Platforms: Windows, MacOS, iOS, and Android
Free Trial: Lifetime Life Time Free Basic Plan
Features:
- Infinite Canvas: Miro offers an unlimited canvas that allows teams to build diagrams and map ideas without constraints. I found this incredibly helpful when I worked on a multi-department workflow chart that kept evolving. You can zoom in and out easily, which helps maintain clarity in large, detailed projects. It feels liberating compared to Visio’s more limited space.
- Real-Time Collaboration: Miro supports seamless co-creation, enabling multiple users to work on diagrams at the same time and see updates instantly. I often used this to align with remote teammates during strategy workshops. The instant feedback loop really speeds up decision-making. While testing this feature, I noticed that enabling cursor tracking helps you understand who is working where on the board, which boosts coordination.
- Extensive Template Library: Miro’s library includes a wide range of templates like mind maps, user journey maps, and flowcharts. It saved me countless hours when starting complex diagramming projects. You can pick a template, tweak it, and get started without the fear of a blank canvas. I suggest exploring niche templates like service blueprints to uncover hidden ways to enhance your processes.
- Integration with Popular Tools: Miro integrates smoothly with Microsoft Teams, Slack, Jira, and even Google Drive, allowing you to embed boards directly into your existing workflow. When I linked Miro to Jira, it reduced the constant back-and-forth between design and dev teams. This integration helped maintain context, making project updates clearer and more actionable.
- Easy Shape and Connector Tools: Miro simplifies diagramming with intuitive drag-and-drop shapes and smart connectors that snap perfectly. Even users without a design background can create clean, professional diagrams quickly. I remember helping a non-technical colleague create a network diagram, and she picked it up in minutes. The tool lets you customize shapes and line styles to match your brand, which I found very handy for client presentations.
- Presentation Mode: Miro allows you to transform your board into a guided presentation without switching tools. I used this to walk executives through a new operational model, and it made the flow much smoother. You can highlight specific areas and move step by step to maintain audience focus. While using this feature one thing I noticed was that pre-arranging frames in a logical narrative helps avoid confusion during live sessions.
Pros
Cons
👉 How to Get Miro for Free?
- Visit the official Miro website to start your journey easily and securely
- Select the basic plan option which provides lifetime access without any charges to help you get started right away
- Sign up with your email and enjoy using Miro’s core features for free as long as you need
Life Time Free Basic Plan
2) Edraw Max
Edraw Max allows me to simplify complex ideas into clear, engaging diagrams. I reviewed it in detail and noticed how effortlessly it combines advanced features with a user-friendly layout. It is great for anyone who wants to visualize data without a steep learning curve. This collaborative platform makes it easy to co-create and share updates anytime. During my research, I found that its flexible templates and customization options are ideal for both corporate teams and solo professionals. Music producers usually prefer using its mind mapping feature to brainstorm and organize project elements clearly.

Drag and drop editor: Yes
Offline access: Yes
Supported Platforms: Windows, macOS, and Linux
Free Trial: 7 Days Free Trial
Features:
- Real-Time Collaboration: Edraw Max supports real-time co-editing, making it easy for teams to work on diagrams together and exchange feedback instantly. I once used this feature during a product design workshop, and it kept everyone engaged throughout the session. Changes show up live, so there’s no need for endless email threads. While testing this feature, I noticed that turning on comment mode helps reduce confusion when multiple people edit at the same time.
- Advanced Customization Options: Edraw Max offers deep customization, allowing you to tweak shapes, colors, fonts, and connectors to fit your exact style. I enjoyed personalizing diagrams to align with brand guidelines during client pitches, which made my work stand out. Unlike some rigid tools, this flexibility feels empowering. You can even create your own shape libraries for frequently used elements, which saves time.
- Cloud and Local Save Options: Edraw Max lets you save diagrams either on your local drive or in the cloud, giving you freedom and security. I appreciated this when switching between my home and office setups without losing progress. You can also share cloud links directly with colleagues for quick reviews. I recommend enabling version history in the cloud to easily roll back if mistakes happen during edits.
- Mind Map Modes: Edraw Max’s mind mapping feature supports diverse styles like fishbone, bubble, and timeline layouts. When I facilitated a strategy session, these helped turn scattered ideas into clear action plans. Unlike Visio, this tool feels more playful and encourages creative thinking. You will notice how these different views can unlock fresh perspectives that static diagrams often miss.
- Presentation Mode: You can turn your diagrams into clean presentations without needing extra software, which saves a lot of time. I used this when presenting a business process redesign, and it kept the audience focused on each stage. Switching between diagram view and slides is smooth and intuitive. This feature eliminates the hassle of exporting or recreating slides elsewhere.
- Automatic Layouts: Edraw Max offers smart auto-alignment and layout tools that keep diagrams neat even as they grow complex. I remember creating an org chart with over 50 roles, and the automatic spacing kept everything readable without manual adjustments. This is a major advantage over tools that require constant manual tweaking. There is also an option that lets you lock certain shapes to avoid unintentional shifts during auto-layout, which I found especially useful.
Pros
Cons
👉 How to Get Edraw Max for Free?
- Visit the official Edraw Max website to access the tool easily today
- Sign up to claim the lifetime free basic plan which is ideal for individual users
- Enjoy an additional 7-day trial of the premium plan to explore all advanced features without paying anything
7-Days Free Trial
3) Visme
Visme gave me a fresh perspective on modern design tools. I tested its capabilities thoroughly and was surprised at how comprehensive yet intuitive it feels. This cloud-based platform allows you to create clean diagrams without worrying about software installations. In my opinion, it is an ideal choice if you aim to present data and ideas clearly and attractively. I particularly appreciate how you can export your work in multiple formats, which is helpful to share across different channels. Event planners today typically use Visme to design visual schedules and flowcharts that help teams stay organized and aligned at every stage.
Drag and drop editor: Yes
Offline access: No
Supported Platforms: Windows and Mac
Free Trial: Lifetime Free Basic Plan
Features:
- Extensive Icon and Shape Library: Visme offers thousands of free icons, shapes, and illustrations that help bring your diagrams to life. I often relied on these when creating process maps for client workshops, and they made complex ideas easier to grasp. The variety is impressive, covering everything from business symbols to fun illustrations. I suggest organizing your favorite icons into custom folders to quickly access them during tight deadlines.
- Brand Kit Integration: With Visme, you can embed brand colors, fonts, and logos directly into your diagrams, keeping every asset consistent with your company’s style guide. I used this during a rebranding project and found it invaluable for maintaining a professional look across internal slides and client reports. You don’t have to manually adjust elements each time, which saves a lot of time. This feature feels like a dedicated design assistant that ensures you always stay on brand.
- Animation and Interactivity: Visme lets you make diagrams more dynamic by adding animations and interactive elements like clickable hotspots. I once created a presentation showcasing a new service model, and the interactive flow kept the audience fully engaged. Unlike static diagrams, these elements help you tell a compelling story. While using this feature one thing I noticed was that subtle animations work best to enhance clarity rather than overwhelm viewers.
- Collaboration Tools: Visme’s real-time commenting and editing features allow multiple people to work on diagrams together, making feedback loops much faster. I coordinated a cross-functional product launch plan using these tools and noticed it significantly reduced delays. Team members can tag each other and resolve comments quickly. This level of transparency builds trust and keeps momentum high throughout a project.
- Download and Export Options: You can export diagrams in different formats, including PDF, PNG, and even interactive HTML5 files. I often exported as HTML5 for embedding into client microsites, which impressed stakeholders with interactive visuals. This flexibility supports various workflows without needing extra software conversions. The tool lets you customize export quality settings to fit different use cases, which I found very handy for print and web.
- Flexible Content Blocks: Visme provides pre-made blocks for text, images, and data widgets that can be inserted into diagrams effortlessly. During a tight deadline for a financial report, these blocks helped me build a polished presentation faster than starting from scratch. They maintain visual consistency while allowing room for creative tweaks. You will notice that these blocks encourage modular thinking, which can simplify even the most complex project diagrams.
Pros
Cons
👉 How to Get Visme for Free?
- Visit the official Visme website and sign up for a new account to start designing instantly today
- Activate the lifetime free basic plan that allows you to create simple presentations and graphics without paying anything
- Start exploring essential design tools and templates included in the basic plan to boost your visual communication easily
Lifetime Free Basic Plan
4) Creately
Creately turned out to be a versatile and intuitive tool in my experience. I evaluated this diagramming software carefully and found it to be an excellent solution for both technical and non-technical users. It is important to mention that its strong visual collaboration features help teams work better together in real time. While conducting my evaluation, I noticed it is one of the best choices for anyone who needs flexible customization and smart data integration. Product managers often use Creately to map product feature timelines, allowing cross-functional teams to stay aligned and deliver faster.
Drag and drop editor: Yes
Offline access: Yes
Supported Platforms: Windows, macOS, and Linux
Free Trial: Life Time Free Basic Plan
Features:
- Contextual Task Management: Creately stands out by allowing you to embed tasks directly into diagrams, making them more actionable. You can assign owners, set deadlines, and track progress without switching tools. When I managed a cross-functional workshop, this feature helped us keep discussions focused and tasks visible. I suggest regularly updating task statuses during team meetings to keep everyone aligned and motivated.
- Version History and Tracking: Creately offers detailed version tracking so you can revisit or restore earlier diagram states. I used this when collaborating on a complex system architecture, and it saved us from losing key elements during edits. You can see exactly who made each change, which builds accountability and trust among team members. This feature gives you peace of mind during high-stakes projects.
- Extensive Styling Options: With Creately, you can apply gradients, shadows, and custom themes to make diagrams visually engaging and on-brand. I once customized an entire process flow to match a client’s brand colors for an executive presentation, and it left a strong impression. Unlike rigid diagramming tools, Creately offers true creative freedom. You will notice that these styling options can help simplify complex data by emphasizing critical elements visually.
- Embedded Data Fields: Creately lets you embed custom data fields into shapes, turning visuals into rich data sources. When I designed a marketing workflow, I included metrics like budget estimates and owner details right inside each task element. This made follow-up discussions more efficient and data-driven. While using this feature one thing I noticed was that keeping data fields concise helps avoid clutter and improves overall readability.
- Secure Sharing and Permissions: Creately provides robust sharing features, including password protection and role-based access to control who can view or edit diagrams. I valued this while working on a confidential merger roadmap that required tight access restrictions. You can confidently collaborate without worrying about data leaks. The tool lets you revoke access instantly if team roles change, adding an extra layer of security.
- Multiple View Modes: Creately’s multiple view modes allow you to switch between list, canvas, and form views for the same dataset. I found this especially helpful when aligning executive overviews with detailed technical plans. You can analyze data, make updates, and visualize connections all in one place. This flexibility supports different thinking styles and helps teams stay on the same page during dynamic projects.
Pros
Cons
👉 How to Get Creately for Free?
- Visit the official Creately website and sign up for a new account to start using its diagramming tools today
- Activate the free plan to create unlimited public documents and collaborate with your team without paying anything
- Explore all the basic features and templates included to help you quickly design flowcharts, mind maps, and more with ease
Life Time Free Basic Plan
5) Visor
Visor is an excellent platform that I analyzed for this guide on Best FREE Microsoft Visio Alternatives. I particularly liked how it puts team collaboration at the center of its design philosophy. Its ability to integrate with Jira and other major tools makes it a top choice for companies needing agile planning capabilities. As I carried out my evaluation, I noticed it helps you visualize workflows and manage changes with ease, making it ideal for teams that need flexibility. For instance, engineering teams typically leverage Visor to synchronize sprint schedules, which allows them to resolve issue faster and enhance overall project outcomes.
Drag and drop editor: Yes
Offline access: Yes
Supported Platforms: Windows, iOS, and Android
Free Trial: Lifetime Life Time Free Basic Plan
Features:
- Two-Way Syncing: Visor’s two-way syncing feature allows you to update data directly within Visor, and those changes reflect back in tools like Jira, Asana, or Salesforce instantly. I used this when coordinating a product launch across several teams, and it saved me endless back-and-forth edits. This seamless integration makes workflows faster and reduces manual errors. While testing this feature, I noticed it’s important to double-check field mappings to prevent accidental overwrites during the first few syncs.
- Gantt and Timeline Charts: Visor lets you build dynamic Gantt charts and timelines to clearly show project phases, deadlines, and dependencies. When I managed a cross-department migration project, these visuals helped everyone understand the big picture without endless meetings. Unlike static Visio diagrams, updates here are real-time and interactive. You can adjust tasks on the fly and instantly see the ripple effects on your entire plan.
- Flexible Kanban Boards: Visor’s Kanban boards are fully interactive and sync with other views, giving teams an intuitive way to track progress. I remember switching tasks between columns during a marketing campaign review, and it immediately updated our timeline chart. This flexibility keeps teams focused and minimizes confusion. The boards feel more alive compared to rigid alternatives and encourage faster decision-making.
- Easy Dashboards: In Visor, you can design dashboards that combine charts, text, and data summaries, giving leaders instant visibility into key project metrics. I once created a custom dashboard for a client presentation that pulled live data, impressing stakeholders with its clarity. I recommend tailoring each dashboard to highlight just the most essential KPIs rather than cramming in too much data.
- Fast Multi-Project Import: Visor allows you to pull in several projects from Jira or Asana in a matter of minutes using simple selectors or JQL. I tried this while consolidating three separate sprint backlogs, and it drastically simplified planning. You avoid messy spreadsheets and manual copy-paste errors. This feature feels like a big leap forward if you’re juggling large or distributed projects.
- Color Coding and Conditional Formatting: With Visor, you can set exact HEX colors and create custom formatting rules to highlight critical data points in charts and tables. While using this feature one thing I noticed was that clear color coding makes meetings much smoother since priorities jump off the screen. Teams can focus on what matters most without wading through cluttered visuals.
Pros
Cons
👉 How to Get Visor for Free?
- Visit the official Visor website and create your new account to get started
- Sign up for the platform and access the Lifetime free basic plan without any payment required
- Enjoy the essential features included in the Lifetime free basic plan to manage your projects effectively
Lifetime Free Basic Plan
6) LucidChart
Lucidchart made a strong impact on me with its modern approach and easy sharing features. I analyzed this web-based tool and saw it is great for anyone needing a fast, clear solution to diagramming challenges. It is best for professionals who aim to collaborate smoothly without constant back-and-forth emails. I particularly appreciate its live data connections, which make updating charts a breeze. HR departments these days typically use Lucidchart to build organizational charts that adapt to staffing changes quickly and provide clear structure for all employees.

Features:
- Data-Linked Diagrams: Lucidchart allows you to connect diagrams directly to live data from spreadsheets or external apps, keeping visuals up to date without manual work. I used this during a sales performance dashboard project, and seeing numbers auto-update saved hours each week. This feature feels like a living document that evolves with your data. I recommend setting clear data source permissions to avoid unexpected updates that could confuse stakeholders.
- Offline Mode: With Lucidchart’s offline mode, you can keep editing even without an internet connection, which is a lifesaver during travel or in areas with unstable Wi-Fi. I worked on an IT architecture diagram during a long flight, and it synced smoothly once I landed. This feature helps you stay productive anytime, anywhere. Unlike most diagramming tools that rely solely on cloud connectivity, Lucidchart ensures you never lose momentum on critical tasks.
- Advanced Export Options: Lucidchart supports exporting diagrams in formats like PDF, PNG, and SVG, making it easy to include visuals in different types of documents and presentations. I often exported high-resolution PNGs for executive briefings, and they looked sharp on large screens. You can also adjust quality and transparency settings as needed. While using this feature one thing I noticed was that exporting as SVG maintains crispness when scaling diagrams for print banners or big slides.
- Hotspot and Interactive Elements: Lucidchart offers the ability to add clickable hotspots to your diagrams, turning them into interactive prototypes or navigation mockups. I once built an interactive product roadmap, and stakeholders loved exploring features by clicking through. This feels more engaging than static presentations. You will notice that using hotspots helps simplify complex explanations since users can focus on one part at a time.
- UML and Technical Diagram Support: Lucidchart provides dedicated libraries for UML, ER diagrams, and network diagrams, which makes it a strong choice for engineering teams looking to move away from Visio. When I worked on a backend system redesign, these technical shapes helped me communicate architecture clearly to developers and non-tech leads. The specialized templates reduce setup time and keep diagrams accurate. This feature sets Lucidchart apart from generic diagram tools.
- Publishing and Embedding: Lucidchart lets you publish diagrams as live links or embed them directly into websites and wikis. I embedded a dynamic org chart into an internal wiki, and updates automatically reflected without re-uploading static files. This keeps stakeholders aligned and reduces version confusion. The tool lets you control access levels on published diagrams, which I found crucial when sharing sensitive or evolving information.
Pros
Cons
👉 How to Get LucidChart for Free?
- Visit the official LucidChart website and create an account to begin designing diagrams and flowcharts right now
- Activate the lifetime free plan which gives you access to essential diagramming tools and allows you to collaborate on basic projects at no cost
- Enjoy a 7-day trial of any paid plan so you can explore premium features and decide if they match your advanced needs
Link: https://www.lucidchart.com/pages/examples/visio-alternative
7) Google Drawings
Google Drawings stood out to me with its straightforward approach. I analyzed this diagramming application and realized it is a powerful option for those who need quick diagrams without a learning curve. It is perfect for anyone who aims to present ideas clearly and collaborate on the fly. I particularly appreciate the shortcuts and real-time editing, which help you move fast and stay organized. Project coordinators these days rely on Google Drawings to create timeline visuals and status charts that make progress updates easy to share with the entire team.

Features:
- Flexible Export Options: Google Drawings allows you to export diagrams in various formats such as PNG, JPEG, PDF, and SVG, making it easy to share across different platforms. I used to export strategy visuals as PDFs for stakeholder meetings and as PNGs for internal newsletters. This flexibility saves time and supports different presentation needs. I suggest checking export resolution settings carefully to maintain sharpness, especially when printing larger diagrams.
- Snap-to-Grid and Alignment Tools: With Google Drawings, you get intuitive snap-to-grid and alignment guides that help you position shapes accurately without endless manual tweaking. When I created a detailed flowchart for a website redesign, these tools kept everything perfectly aligned. You don’t need advanced design skills to achieve a professional look. You will notice that using these guides consistently speeds up your workflow and prevents misaligned elements that can confuse viewers.
- Link and Hyperlink Support: Google Drawings lets you add hyperlinks to shapes and text, transforming static visuals into interactive navigation tools. I once built an interactive organization chart that linked directly to team pages, which was a hit with new hires. This feature feels like adding a second layer of information without cluttering the design. It’s a powerful way to make diagrams more engaging and practical for presentations or training materials.
- Commenting and Suggestion Mode: You can leave comments directly on specific elements in Google Drawings, which makes feedback simple and fast. During a cross-team planning session, I relied on this feature to clarify design decisions without shifting to email threads. This keeps all context within the diagram itself and promotes quick resolution. While testing this feature, I noticed tagging teammates directly in comments speeds up approvals and avoids misunderstandings.
- Infinite Canvas-Like Expansion: Although not truly infinite, Google Drawings allows you to extend the canvas significantly beyond normal slide limits. I once created a large product roadmap that spanned several quarters without breaking it into multiple files. This capability makes it possible to visualize big-picture plans in one cohesive space. The tool lets you adjust canvas size as needed, supporting projects that require more room to breathe.
- Embed in Web Pages: Google Drawings diagrams can be published and embedded directly into websites or blogs using shareable HTML code. I embedded a process flow diagram into a client portal, and updates reflected automatically without re-uploading. This ensures viewers always see the most current version. It’s a convenient way to maintain dynamic, live visuals for external audiences without extra maintenance work.
Pros
Cons
👉 How to Get Google Drawings for Free?
- Visit the official Google Drawings website and sign in with your Google account to start creating diagrams today
- Activate the lifetime free plan that allows you to design flowcharts, mind maps, and other visuals without any payment or hidden costs
- Start using various shapes, connectors, and collaborative tools included in the plan to build and share your projects easily
Link: https://docs.google.com/drawings/
8) Smartdraw
SmartDraw impressed me with how effortlessly it simplifies complex information. I analyzed this tool for making and organizing flowcharts and realized it is a top choice for companies that value clarity and speed. I particularly appreciate its wide variety of business-ready templates, which help teams start fast and stay consistent. The tool made it possible for even non-technical staff to create diagrams without stress. Marketing agencies today typically use SmartDraw to design campaign process maps that keep all departments focused and support smooth project execution from start to finish.

Features:
- Intelligent Formatting: SmartDraw’s intelligent formatting keeps diagrams neat by automatically aligning, resizing, and spacing shapes as you build. I remember creating a complex decision tree, and this feature saved me from endless manual adjustments. You can focus on content rather than constantly fixing layouts. While testing this feature, I noticed locking certain elements first helps maintain critical structure when adding new shapes later.
- Automated Org Charts: With SmartDraw, you can instantly generate organizational charts from imported data like spreadsheets or HR databases. I once used this to visualize a 300-person department restructure in just a few clicks, which would have taken days manually. This automation reduces errors and keeps charts up to date effortlessly. You can even update source files to reflect team changes automatically without rebuilding from scratch.
- Intelligent Floor Planning: SmartDraw offers specialized tools for creating accurate floor plans and office layouts with built-in dimensioning support. I designed a new office seating arrangement and found the auto-dimensioning feature incredibly accurate, avoiding costly space planning mistakes. Unlike generic diagram tools, this feels like a dedicated space design app. You will notice it simplifies collaboration with facility teams by making visuals clear and precise.
- Automated Process Mapping: SmartDraw can convert text outlines or data tables directly into process maps, speeding up documentation work dramatically. I once transformed a compliance procedure document into a clear workflow diagram in under an hour, which impressed the audit team. This feature helps maintain consistency across complex processes and reduces manual rework. It’s a major advantage for teams needing to map out SOPs quickly.
- Advanced Export Options: SmartDraw allows you to export diagrams to PDF, PNG, SVG, and directly into Microsoft Word or PowerPoint. I regularly inserted workflows into executive decks without losing resolution or formatting, which helped make my reports stand out. The ability to maintain vector quality when exporting to slides is a huge plus. I recommend double-checking text sizes before exporting to avoid scaling issues in presentation formats.
- Intelligent Shape Data Fields: SmartDraw includes a lesser-known feature that lets you embed custom data fields inside shapes, supporting dynamic data display and conditional formatting. I integrated budget figures and approval statuses into a project timeline diagram, creating a richer, more informative visual. This makes it easier to discuss data-driven decisions during meetings. The tool lets you even filter shapes based on embedded data, which I found particularly helpful for executive summaries.
Pros
Cons
👉 How to Get Smartdraw for Free?
- Go to the Smartdraw website and sign up for an account so you can start designing and creating diagrams immediately today
- Use the lifetime free plan that offers essential diagramming features and sharing options to help you work on projects at no cost
- Take advantage of various pre-built templates and customization options to make clean and professional diagrams without spending money
Link: https://www.smartdraw.com/
9) Draw.io
Draw.io felt like a refreshing option for visual planning. I tested this open-source platform and realized it offers all you need to build flowcharts and technical diagrams without extra complications. It is a great way to avoid expensive software and still achieve professional results. In my opinion, its strong security focus and device flexibility make it an excellent choice for both large organizations and freelancers. Product designers typically prefer Draw.io to outline user flows and wireframes, helping teams visualize product experiences and reduce costly design changes later on.

Features:
- Extensive Shape Libraries: Draw.io offers rich shape libraries covering business, engineering, software, and more, making it easy to create precise visuals for any project. I once built a network architecture diagram for a client presentation, and the ready-made shapes helped me finish in record time. You don’t need to search elsewhere for specialized icons. I suggest bookmarking your most-used libraries so you can access them faster during high-pressure deadlines.
- Real-Time Collaboration: Draw.io supports live editing with multiple users, keeping teams aligned even when working remotely. I worked with a distributed design team, and seeing updates in real time eliminated miscommunication and sped up reviews. You can also comment directly on diagram elements, which encourages quick feedback cycles. This feels similar to Google Docs but tailored for visual work, which makes it surprisingly intuitive for new users.
- Layering and Grouping: With Draw.io, you can use layers and grouping to manage complex diagrams effortlessly. When I mapped out a multi-level system architecture, these features kept each module separate and clear. You can toggle visibility on different layers to focus discussions or simplify views for different audiences. This makes handling large diagrams less stressful and more organized than using flat, single-layer tools.
- Embedded HTML and Interactive Elements: Draw.io allows you to embed diagrams as interactive HTML into websites, turning static visuals into dynamic assets. I once added an interactive product flowchart to a client portal, and stakeholders appreciated the ability to click through different sections. Unlike static images, these updates reflect live changes automatically. While testing this feature, I noticed setting clear clickable zones keeps interactions intuitive and avoids user confusion.
- Automatic Layout Tools: Draw.io includes smart auto-arrange functions that neatly position shapes and connectors without manual dragging. I used this to clean up a messy workflow chart during a sprint planning meeting, and it transformed the diagram in seconds. This helps maintain a professional look even if you build diagrams quickly. You will notice that auto-layout reduces fatigue and saves time during iterative design sessions.
- Custom Shape Creation: Draw.io lets you design and save your own shapes, providing total flexibility for niche requirements. I created custom security icons for a compliance diagram, which wasn’t possible with standard libraries. This capability supports advanced use cases and gives diagrams a personalized touch. The tool lets you reuse these shapes across future projects, which speeds up diagram creation and builds consistency.
Pros
Cons
👉 How to Get Draw.io for Free?
- Visit the official Draw.io website and start a new diagram to immediately access its free design and diagramming tools today
- Use the free-to-use option that allows you to create unlimited diagrams and collaborate with others without needing to pay anything
- Explore all available shapes, templates, and customization features to build clear visuals and export them whenever you need
Link: https://app.diagrams.net/
Feature Comparison Table
How Did We Choose Best FREE Microsoft Visio Alternatives?
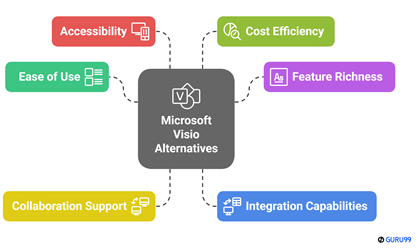
At Guru99, our dedication to credibility is unwavering, with a strong focus on providing accurate, relevant, and objective information. We have spent over 100 hours testing and comparing more than 40 tools to create this comprehensive, honest guide to the Best FREE Microsoft Visio Alternatives, covering both free and paid options. I admired one platform’s intuitive design and robust collaboration features, making it a practical and versatile choice. This transparent breakdown of each tool’s features, pros and cons, and pricing ensures a trusted, well-researched resource. We focus on the following factors while reviewing a tool based on.
- Ease of Use: We chose based on intuitive interfaces that simplify complex diagramming tasks so you can work rapidly.
- Feature Richness: The experts in our team selected tools offering advanced templates and shapes to help you design with ease.
- Collaboration Support: We made sure to shortlist options that allow real-time sharing and edits for smooth teamwork without compromise.
- Integration Capabilities: Our team chose tools that connect seamlessly with other software to enhance productivity and save time.
- Accessibility: We selected platforms that are web-based and cross-device compatible in order to ensure your projects remain consistent.
- Cost Efficiency: We focused on free solutions that provide maximum value and functionality without hidden costs or complex setups.
Verdict
In this review, you got acquainted with some of the top-rated diagramming tools. All of them come with unique strengths and practical capabilities that can resolve many common visualization challenges. To help you take the final call, I have created this verdict.
- Miro: An impressive, user-friendly tool that excels in real-time collaborative whiteboarding and supports infinite canvas for endless creativity. I recommend it if you want a robust, secure, and flexible alternative to Visio with strong integrations.
- Edraw Max: A comprehensive and customizable solution ideal for advanced diagramming needs. Its wide diagram library and seamless exports make it a top choice for anyone needing versatile and professional-grade visuals.
- Visme: A versatile visual content platform that excels at turning data and ideas into polished diagrams, infographics, and presentations. I recommend it if you want an all-in-one design tool with an extensive template library and strong brand controls for client-ready visuals.
FAQs
Miro is a collaborative online whiteboard with over 1,000 templates including mind maps, Kanban boards, Gantt charts, product wireframes, research boards, and flowcharts.