8 BEST Reporting Tools And Software (2026)

Data without direction is just noise. The best reporting tools and software transform scattered data into structured insights with precision and purpose. These platforms are not merely visual aids—they are decision-driving engines that support operational clarity and strategic foresight. As a SaaS specialist, I rely on my experience to guide you through selecting tools that align with specific business objectives. Modern trends point to AI-enhanced automation and real-time analytics reshaping data storytelling.
After spending over 110 hours analyzing 30+ reporting solutions, I carefully compiled this well-researched and unbiased guide to the BEST Reporting Software. It features both free and paid tools, evaluated for their usability, features, pros and cons, and pricing. I once tested a solution that looked promising but failed under pressure—this highlighted the need for honest, professional reviews. This may help readers make credible and informed decisions. Read more…
Zoho Analytics is a self-service business intelligence and analytics platform. It features an AI powered assistant that enables users to ask questions and get intelligent answers in the form of meaningful reports.
BEST Reporting Software: Top Tools!
| Name | Best For | Ease of Use | Dashboard Customization | Free Trial | Link |
|---|---|---|---|---|---|
Zoho Analytics |
Unified BI with AI-driven insights | Moderate | ✔ | 15-day free trial | Learn More |
ADManager Plus |
Active Directory management and reporting | Easy | ✔ | 30-day free trial | Learn More |
Whatagraph |
Visual marketing reports | Moderate | ✔ | ❌ | Learn More |
SAP Crystal Reports |
Enterprise-grade, static report generation | Steep | ✔ | ❌ | Learn More |
Wrike |
Project management and team reporting | Easy | ✔ | 14-day free trial | Learn More |
1) Zoho Analytics
Zoho Analytics truly impressed me with its depth and flexibility. I evaluated this tool for creating automated reports across departments, and it allowed me to merge multiple data sources without hassle. The AI assistant was not just smart; it was efficient in helping me extract insights quickly. For anyone looking to avoid the chaos of scattered data, this is a great option. It is one of the easiest ways to keep stakeholders informed and confident.
Integration: Zendesk, Jira, Salesforce, HubSpot, Mailchimp, and Eventbrite
Real-Time Reporting: Yes
Supported Platforms: Windows, iOS and Android
Free Trial: 15 Days Free Trial (No Credit Card Required)
Features:
- AI-Generated Insights: Zoho Analytics uses AI to scan your datasets and automatically highlight key patterns, outliers, and trends. This saves you from sifting through endless rows of data to find what matters. I’ve used this for weekly sales reports, and it consistently surfaced insights that I’d otherwise miss. You will notice it often flags underperforming areas, giving you a head start on corrective action.
- Smart Data Preparation: This feature lets you clean, merge, and transform data before it reaches your reports. I found it especially handy when consolidating CSV exports from different platforms. Zoho’s AI suggests enrichment steps, which help in maintaining consistency. There is also an option that lets you automate repetitive cleanup tasks, which cuts down prep time drastically.
- Drag-and-Drop Interface: Creating reports in Zoho Analytics is incredibly easy, thanks to its intuitive drag-and-drop builder. You don’t need any coding background, which makes it accessible for business users. I’ve personally used it during a marketing audit, and building pivot tables was just a few clicks. I recommend using the “custom formula” block to get even more tailored visualizations without writing SQL.
- Auto-Data Sync: You can schedule automatic syncing from various data sources like CRMs, databases, or spreadsheets. This ensures your reports are always updated with real-time data. While using this feature, one thing I noticed was how seamless the sync felt, especially when pulling data from Zoho CRM. I suggest setting up sync intervals during off-peak hours to avoid slowdowns.
- Custom Dashboards: Zoho Analytics allows you to design role-specific dashboards with metrics that matter most to each department. You can mix KPIs, charts, widgets, and even images or HTML blocks. I once built a sales dashboard for a regional team, and the feedback was overwhelmingly positive. The tool lets you apply user-level filters so everyone sees data relevant to their role.
- Embedded Analytics: You can integrate interactive dashboards right into your own web platforms, giving users direct access to data in context. This is excellent for SaaS apps or internal portals. I worked on a project where we embedded client analytics into a customer portal—it significantly improved engagement. I suggest customizing the embedded theme to match your branding for a seamless user experience.
Pros
Cons
Pricing:
- Price: Plans start at $14.04 per month.
- Free Trial: 15-day free trial (No credit card required)
15-Days Free Trial
2) ADManager Plus
ADManager Plus truly impressed me with its comprehensive reporting capabilities and automation features. I evaluated this tool for creating detailed Active Directory reports across departments, and it allowed me to generate compliance reports without hassle. The automated reporting engine was not just smart; it was efficient in helping me extract AD insights quickly. For anyone looking to avoid the chaos of manual AD reporting, this is a great option. It is one of the easiest ways to keep IT stakeholders informed and confident about AD security and compliance.
Integration: Zendesk, ServiceNow, BambooHR, Workday
Real-Time Reporting: Yes
Supported Platforms: Windows and Cloud platforms
Free Trial: 30 Days Free Trial
Features:
- Comprehensive AD Reporting: ADManager Plus provides over 150 pre-built reports covering user accounts, groups, computers, and organizational units. This saves you from building reports from scratch to monitor AD health. I’ve used this for quarterly compliance audits, and it consistently provided detailed insights into user permissions and group memberships. You will notice it often flags inactive accounts and security vulnerabilities, giving you a head start on remediation.
- Automated Report Scheduling: This feature lets you schedule reports to run automatically and deliver them via email to stakeholders. I found it especially handy when generating weekly security reports for management. The tool suggests optimal scheduling intervals based on report complexity. There is also an option that lets you customize report formats (PDF, CSV, HTML), which cuts down manual distribution time drastically.
- Custom Report Builder: Creating custom reports in ADManager Plus is incredibly flexible, thanks to its intuitive report designer. You don’t need any scripting background, which makes it accessible for IT administrators. I’ve personally used it during a security audit, and building custom compliance reports was straightforward. I recommend using the “advanced filters” to get even more targeted reports without writing complex queries.
- Real-time AD Monitoring: You can monitor Active Directory changes in real-time and generate instant reports on critical modifications. This ensures your compliance reports are always updated with current AD status. While using this feature, one thing I noticed was how quickly it detected unauthorized changes, especially in privileged group memberships. I suggest setting up real-time alerts during business hours to catch security issues immediately.
- Role-based Report Access: ADManager Plus allows you to design role-specific reporting dashboards with metrics that matter most to each department. You can control who sees what data based on organizational hierarchy. I once built a security dashboard for the compliance team, and the feedback was overwhelmingly positive. The tool lets you apply user-level permissions so everyone sees only relevant AD data.
- Compliance Reporting Suite: You can generate compliance reports for standards like SOX, HIPAA, and PCI-DSS directly from your AD data, giving auditors exactly what they need. This is excellent for organizations with strict regulatory requirements. I worked on a project where we automated GDPR compliance reporting—it significantly reduced audit preparation time. I suggest customizing the compliance templates to match your specific regulatory requirements for seamless audit processes.
Pros
Cons
Pricing:
- Price: Plans start at $595 per year for Standard Edition.
- Free Trial: 30-day free trial (No credit card required)
30-Days Free Trial
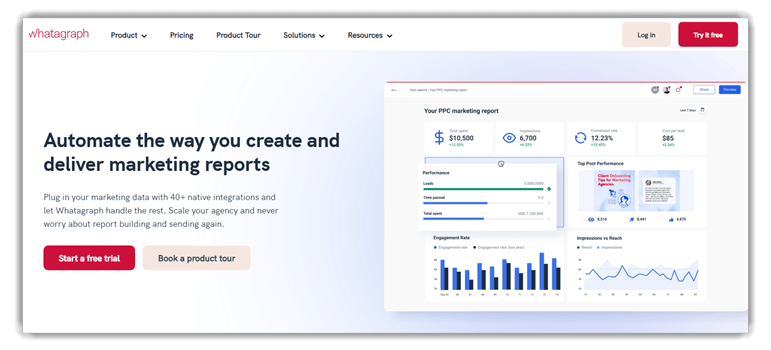
3) Whatagraph
Whatagraph allowed me to streamline how I build campaign reports. I could access multiple data sources like Google Analytics and Facebook Ads in one dashboard. This helped me cut reporting time drastically. In my opinion, it is a great way to manage multiple client campaigns. I found that the tool is ideal for marketing agencies aiming to deliver top-notch, customized reports effortlessly.
Features:
- 50+ Native Integrations: Whatagraph connects with over 50 platforms like Google Analytics, HubSpot, LinkedIn Ads, and more. I used it to streamline multi-client reporting in an agency environment, where pulling data from various sources was a daily chore. The native integrations reduce setup time significantly. I recommend using the connection health checker to ensure your data flows remain uninterrupted.
- Custom API & BigQuery Support: This feature allows you to import data from unique internal systems or massive datasets stored in BigQuery. I once connected a custom-built CRM via API, and it synced smoothly without extra engineering support. It’s great for companies with proprietary data needs. There is also an option that lets you schedule these imports, keeping your reports automatically updated.
- Cross-Channel Data Blending: Whatagraph lets you combine metrics from different platforms into one dashboard, giving a complete view of campaign performance. While using this, I blended data from Google Ads and Meta Ads to show overall ROAS by audience segment. It removed the guesswork from comparing results. You will notice that this feature supports advanced filtering, which is helpful for isolating patterns.
- Real-Time Data Updates: Your reports update automatically as data changes in connected platforms. This has been valuable when tracking daily spending and conversions during live campaigns. I remember running a launch week where real-time metrics helped us optimize ads on the fly. While testing this feature, I suggest enabling notifications for data sync issues so nothing gets missed.
- Media Widgets: This tool adds a visual layer to reports by pulling in creatives from your social posts or display ads. It’s one of the features that sets Whatagraph apart from more data-centric platforms. I’ve used it for client reports, and it makes presentations far more compelling. I suggest pairing media widgets with performance metrics to show both what ran and how it performed.
- Custom Calculations: You can build unique KPIs with your own formulas using data from multiple sources. I used this to create a blended cost-per-lead metric that included both paid and organic traffic. It gave the marketing team a more realistic view of ROI. The tool lets you save these calculations as templates, which speeds up reporting across clients or projects.
Pros
Cons
Pricing:
- Price: Request a free quotes from sales
Link: https://whatagraph.com/
4) SAP Crystal Reports
SAP Crystal Reports offered me the kind of depth I rarely see in legacy reporting tools. During my analysis, I was able to create dynamic content blocks that adapt based on the data context. It is best for businesses that need detailed, audit-friendly reports. Keep in mind that the software is ideal for regulatory reporting environments where precision is required.

Features:
- Data Connectivity: SAP Crystal Reports supports a wide range of data sources, including SAP HANA, Oracle, SQL Server, and Excel. I’ve used it in enterprise settings to pull structured data directly from SAP systems, ensuring accuracy and traceability. It also handles multiple data source connections well. I suggest organizing your data source aliases clearly to prevent confusion during large report builds.
- Pixel-Perfect Formatting: This feature gives you full control over layout and design, which is critical for reports like invoices or regulatory documents. I worked on a finance project where alignment and precision were non-negotiable, and Crystal Reports delivered flawlessly. While using this feature, one thing I noticed was that anchoring text boxes avoids misalignment during data refreshes.
- Advanced Charting: Crystal Reports includes several chart options like bar, pie, area, and scatter plots. These help transform data into visuals that are easy to interpret. I’ve used the combination chart feature to overlay trends across departments, which highlighted performance gaps clearly. The tool lets you bind charts to formulas, unlocking powerful comparisons and trend analysis.
- Subreports: You can embed subreports within main reports to display related data side by side. This is particularly useful in financial reporting or client summaries. I once built a report showing project spend with nested subreports for each department. There is also an option that lets you link subreport parameters to the main report, ensuring consistent filtering.
- Parameter Fields: Crystal Reports allows you to insert parameter fields so users can filter reports dynamically. I used this to let regional managers generate reports by location and quarter without editing the source file. It significantly reduced support requests. I recommend grouping parameter fields logically for better usability, especially when reports have multiple filters.
- Formula Editor: The formula editor is robust, offering functions for strings, math, dates, and logic operations. I created custom fields to calculate year-over-year growth within the report, which saved hours of post-processing. You will notice it also supports nested IF conditions and shared variables, which help manage complex reporting logic efficiently.
Pros
Cons
Pricing:
- Price: The full version is available for a one-time fee of $367.23.
Link: https://www.sap.com/products/technology-platform/crystal-reports.html
5) Board
Board gives businesses a reporting system that does more than just present data. I checked its features and noticed the tight integration across planning and forecasting. In the course of my review, I saw how effortlessly it connects diverse departments using real-time data. It is perfect for companies that need precision in decision-making. It is a top-rated option for reporting and strategy alignment.

Features:
- Unified Planning Platform: Board brings business intelligence, performance management, and analytics together in one place. I used it while consulting for a retail chain that needed a unified solution for planning and reporting. It reduced tool-switching and data inconsistencies. I suggest taking advantage of its built-in connectors to align data pipelines early in your setup process.
- No-Code Development: This feature enables users to build models, dashboards, and automation without writing a single line of code. It’s highly intuitive, even for non-technical teams. I once trained a marketing department to create their own ROI dashboards in under a week. While using this feature, one thing I noticed was that modular design blocks save time when replicating dashboard layouts.
- Intelligent Forecasting: Board uses AI to deliver reliable forecasts based on historical data and real-time trends. I’ve used it in budgeting cycles where demand shifts often, and the predictive accuracy stood out compared to Excel-based methods. The tool lets you apply seasonality and external drivers, which sharpens forecast reliability even in volatile industries.
- Scenario Simulation: Users can test different business scenarios, such as pricing changes or supply disruptions, and see their potential impacts. I ran several “what-if” simulations during a product expansion plan, and it helped our executive team avoid overstocking. You will notice it supports side-by-side comparisons that make decision-making faster and more informed.
- Financial Consolidation: This feature simplifies combining financials from multiple departments or regions. It also supports auditing and compliance workflows. I worked on a multi-entity setup and found the Board’s automated adjustments and currency conversion tools highly effective. There is also an option that lets you create versioned consolidation reports for historical comparisons during audits.
- Workflow Management: Board enables the automation of workflows from data entry through to approvals and reporting. This has been useful in large organizations where cross-department collaboration is critical. I’ve seen teams reduce report finalization time by days. I recommend defining approval hierarchies early so bottlenecks don’t appear later during reporting deadlines.
Pros
Cons
Pricing:
- Price: Request a free quotes from sales
Link: https://www.board.com/en
6) Insight software
Insight software was a practical solution when I needed to create and distribute reports faster. During my research, I liked how well it integrates with existing systems. It might be helpful to businesses aiming to reduce reporting delays. It also provides customization that ensures every team gets exactly the data they need. Insurance agencies rely on Insightsoftware to provide branch-level profitability updates, helping leaders react to underperformance early.

Features:
- Real-Time ERP Integration: Insight Software connects with over 140 ERP systems, giving you live access to financial and operational data directly within Excel. I’ve used it with Microsoft Dynamics and saw immediate value in how quickly data reflected real-time changes. While using this feature, one thing I noticed was that real-time refreshes minimized reconciliation errors during closing periods. It’s a major time-saver during audits or month-end processes.
- Distribution Manager: This tool automates the process of sending reports through email or shared folders. It’s especially useful when reports must reach multiple stakeholders regularly. I’ve configured it for weekly executive briefings, and the delivery was seamless. There is also an option that lets you apply dynamic naming and filters, which helps personalize reports for each recipient.
- Excel-Based Reporting: Users work directly within Excel, making report creation and customization feel familiar and efficient. It reduces the learning curve significantly, especially for finance teams already comfortable with spreadsheets. I trained a junior accountant to build their first report in under two hours. I recommend saving templates with named ranges to speed up future report cycles.
- Drill-Down Capabilities: You can explore financial data down to transaction-level details without leaving Excel. This helps users identify discrepancies or trends quickly. I once used it to trace a budget overrun back to a specific vendor invoice—without needing IT support. You will notice how the drill paths follow natural hierarchies, making analysis both intuitive and efficient.
- Query Designer: This feature lets non-technical users build tailored queries without needing SQL knowledge. I’ve used it to pull department-level expense data filtered by region and month. It’s highly visual, and changes can be made without restarting the entire report. I suggest testing queries with smaller datasets first to ensure they return accurate results before scaling.
- Formula Builder: Formula Builder helps create advanced calculations using a simple interface that links live ERP data to Excel formulas. This eliminates the risk of static data errors. I created a variance analysis model using it, and it updated automatically each time the ERP was refreshed. The tool lets you store formulas for reuse, which is ideal for recurring monthly reporting.
Pros
Cons
Pricing:
- Price: Request a Personalized Demo
Link: https://insightsoftware.com/solutions/report-distribution/
7) Agency analytics
Agency Analytics made it possible for me to connect SEO, email, PPC, and more in one platform. I tested its dashboard customization and liked how visually clear everything looked. It is a good idea to rely on one tool for all your reporting needs. In fact, it helped me avoid switching between tabs and spreadsheets. Local agencies are using Agency Analytics to centralize campaign performance, helping account managers present clearer insights during client calls.

Features:
- Automated Reporting: AgencyAnalytics allows you to schedule report deliveries on a daily, weekly, or monthly basis. I’ve used it to automate client updates, and it completely removed the need for manual report prep. Reports go out with consistent formatting and the latest data. I suggest customizing report templates for each client to align insights with their business goals.
- SEO Tools Suite: This tool includes rank tracking, backlink analysis, and technical audits all in one place. I’ve relied on it for quick visibility into on-page and off-page SEO issues across multiple clients. It’s comprehensive enough to replace several standalone tools. While testing this feature, I found the automated issue prioritization helpful for identifying quick-win optimizations.
- Social Media Analytics: Get detailed insights across platforms like Facebook, Instagram, LinkedIn, and Twitter. You can monitor follower growth, engagement, and ad performance in real time. I used this during a product launch to keep an eye on ad performance and tweak creatives quickly. You will notice the dashboards support client-specific branding, which makes them look more polished during presentations.
- Email & Call Tracking: This feature ties in with tools like CallRail and Mailchimp to show exactly which communications drive conversions. I once used it to analyze a campaign’s lead source split, and the call data revealed a surprising offline trend. The tool lets you filter by campaign or channel, which adds depth to your attribution models.
- Campaign Tagging: With campaign tagging, you can categorize and organize efforts by goal, platform, or region. It’s especially helpful when managing high volumes of cross-channel campaigns. I found it streamlined reporting by letting me generate segmented views quickly. There is also an option that lets you apply multiple tags to a single campaign, which boosts flexibility in analysis.
- Goal Tracking: Set marketing objectives and visualize progress right on the dashboard. I’ve seen teams become more focused just by having real-time goal metrics in front of them. It also helped in client reviews, where visual progress made results easier to communicate. I recommend using SMART goal labels so the targets remain measurable and realistic across reporting periods.
Pros
Cons
Pricing:
- Price: Plans start at $79 per month.
- Free Trial: 14-day free trial
Link: https://agencyanalytics.com/
8) BIRT
BIRT offered me a dependable and open-source solution to create business reports inside Java environments. I particularly liked the flexibility of its visual report builder, which helps you reduce setup time. In the review process, it stood out for simplicity and power. Banking software developers embed BIRT into internal risk tools to provide clear visual breakdowns of account risk metrics.

Features:
- Data Visualization Tools: BIRT offers a strong variety of charts like bar, pie, scatter, and bubble to turn raw data into visuals that highlight key patterns. I’ve used its charting features to simplify complex metrics for stakeholder presentations. I suggest adjusting the tooltip formatting to make interactive charts more informative during live demos. It really improves how non-technical users engage with the data.
- Scriptable Report Design: This feature supports Java and JavaScript for building dynamic reports that respond to logic in real time. I once used JavaScript inside BIRT to generate content sections based on user roles, which improved relevance without multiple report versions. You will notice this scripting layer allows you to create conditional logic similar to programming, offering great control for custom layouts.
- Report Designer IDE: BIRT includes an Eclipse-based IDE specifically for report development. It’s developer-friendly and gives full access to layout controls, previews, and embedded code testing. I’ve built reports in it with backend logic baked right into the design phase. I recommend organizing your design files into folders based on modules to make large projects easier to navigate.
- Parameterized Reporting: With BIRT’s parameterized reporting, users can filter and customize the data they want to see at runtime. This boosts interactivity and reduces the need to build multiple reports. I used it to let sales managers generate region-specific views from a single report. There is also an option that lets you pre-populate parameter values from a dataset, streamlining the user experience.
- Master/Sub Reports: BIRT supports hierarchical reporting by nesting subreports within master templates. I built a financial summary report that included embedded details for each department—without needing separate files. This helped executives move between summary and detail views easily. While using this feature, one thing I noticed was that passing parameters between levels required careful mapping, but it worked smoothly once configured.
- Reusable Report Components: You can store and reuse elements like headers, footers, or visual widgets across reports. I found this useful when building a suite of branded reports for a client. Consistency became easy to maintain. The tool lets you centralize shared fragments in a library, so updates reflect instantly across all linked reports.
Pros
Cons
Pricing:
- Price: Free Download
Link: https://eclipse-birt.github.io/birt-website/
Main Types of Reporting Software

When choosing the best reporting tools and software, it’s important to understand the main types available. Each serves a different purpose, and picking the right one depends on your goals, team size, and data needs. Over my 30 years in content creation and tech analysis, I’ve seen how the right tool can truly simplify complex workflows.
- Business Intelligence (BI) Tools: These are advanced platforms like Tableau or Power BI that help you visualize data, create dashboards, and make better decisions. Ideal for medium to large organizations.
- Operational Reporting Software: Tools such as SAP Crystal Reports generate detailed reports from internal systems. They are used for daily operations and often support compliance or audit requirements.
- Financial Reporting Tools: Designed for accounting and finance teams, these tools create accurate income statements, balance sheets, and forecasts. QuickBooks and FreshBooks are common examples.
- Marketing Reporting Tools: Platforms like Google Data Studio and HubSpot offer customizable reports to track campaigns, website traffic, and conversions. I’ve used these for client reporting, and they save a lot of manual work.
- Custom Reporting Tools: Some organizations develop their own tools or use open-source options for specific needs. These offer flexibility but require technical skills to maintain.
How Did We Choose BEST Reporting Tools And Software?

At Guru99, we are committed to delivering credible, accurate, and relevant content that supports informed decision-making. After spending over 110 hours analyzing 30+ reporting solutions, we compiled this well-researched and unbiased guide featuring both free and paid tools. Each option has been rigorously tested for usability, features, pros and cons, and pricing. Our expert team prioritized tools that offer optimized functionality, consistent performance, and user-focused design. We focus on the following factors while reviewing a tool based on.
- Functionality: We chose based on tools that consistently deliver precise data outputs with ease and real-time accuracy.
- User Experience: Our team chose tools offering intuitive design and hassle-free setup for all users without compromise.
- Pricing and Value: We made sure to shortlist free and paid solutions that save time and resources effectively.
- Customization: Experts in our team selected the tools based on adaptability to your needs and workflow preferences.
- Integration: We chose based on how smoothly the software connects with commonly used data sources and BI platforms.
- Support and Updates: Our team prioritized platforms offering reliable support and frequently updated features for long-term usability.
Verdict:
When I am working on reporting for clients or internal operations, the right tool can dramatically improve productivity and insight quality. I always look for a combination of flexibility, real-time updates, and intuitive visualization. If you want clarity in your reports without complexity, check my verdict on the best options available.
- Zoho Analytics: A user-friendly solution that delivers comprehensive, real-time analytics with robust integration support and AI-powered insights.
- ADManager Plus: This tool for creating detailed Active Directory reports across departments, and it allowed to generate compliance reports without hassle.
- Whatagraph: A top-rated choice if you are deciding on a visually impressive, real-time dashboard that supports automated delivery and multi-source aggregation.
FAQs
Zoho Analytics is a self-service business intelligence and analytics platform. It features an AI powered assistant that enables users to ask questions and get intelligent answers in the form of meaningful reports.