
JMeter GUI: Test Plan & Workbench
 Editorial Team
⚡ Smart Summary
JMeter GUI organizes every performance test around two panes: a Test Plan tree on the left and its configuration panel on the right, where elements are added, saved, merged, executed and reported.

As soon as you launch Apache JMeter, the left pane opens with a single root node:
- Test Plan
Older releases showed a second node called WorkBench. Both are covered below.

What is a Test Plan?
A Test Plan is where you add the elements required for your JMeter test.
It stores every element (Thread Groups, timers, samplers, listeners) with the settings needed to run them. Everything you build in the GUI hangs off this root node, as the figure below shows.

What is WorkBench?
The WorkBench was a scratch area that stored test elements temporarily. It had no relation to the Test Plan, and JMeter did not save its contents — only the Test Plan branch was written to disk.

Important: the WorkBench was deprecated in JMeter 3.2 and removed in JMeter 4.0, so it is absent from current releases such as 5.6.3. Non-test elements — the HTTP(S) Test Script Recorder, HTTP Mirror Server and Property Display — now attach directly to the Test Plan. Opening an old plan that still contains a WorkBench converts that branch into a Test Fragment named “WorkBench Test Fragment”. If an older recording walkthrough tells you to right-click WorkBench, use the Test Plan node instead.
How to Add Elements to a Test Plan
Adding elements is the essential step in building a Test Plan, because without them JMeter has nothing to execute. A plan can include listeners, controllers, timers, samplers, assertions and config elements.
You add an element by right-clicking the Test Plan node and choosing from the “Add” list.
Suppose you want to add two elements: a BeanShell Assertion and a Java Request Defaults config element.
- Right-click Test Plan -> Add -> Assertion -> BeanShell Assertion
- Right-click Test Plan -> Add -> Config Element -> Java Request Defaults
The animation below walks through that menu path.

You can also remove an element you no longer need. To delete HTTP Request Defaults: select it -> right-click -> choose Remove -> click Yes to confirm.
Loading and Saving Elements
JMeter can save a single element on its own, not just the whole plan — useful when one assertion or timer is reused across projects. The next two sections cover both halves of that workflow.
How to Create a JMX File
Suppose you have added an element named “BeanShell Assertion” and want to save it on its own. Right-click BeanShell Assertion -> select Save Selection As.

A dialog box opens. Click Save to store the element under the default name BeanShell Assertion.jmx, or choose your own.

Test elements and Test Plans are both stored as *.jmx files — plain XML you can open in any editor or keep in version control. The extension is not Java Management Extensions (JMX), an unrelated Java monitoring API sharing the same three letters.
How to Load and Merge a JMX File
Loading an existing element saves the time you would spend creating and configuring a new one.
Say your Test Plan already holds a Java Request Defaults element. Right-click it -> select Merge.
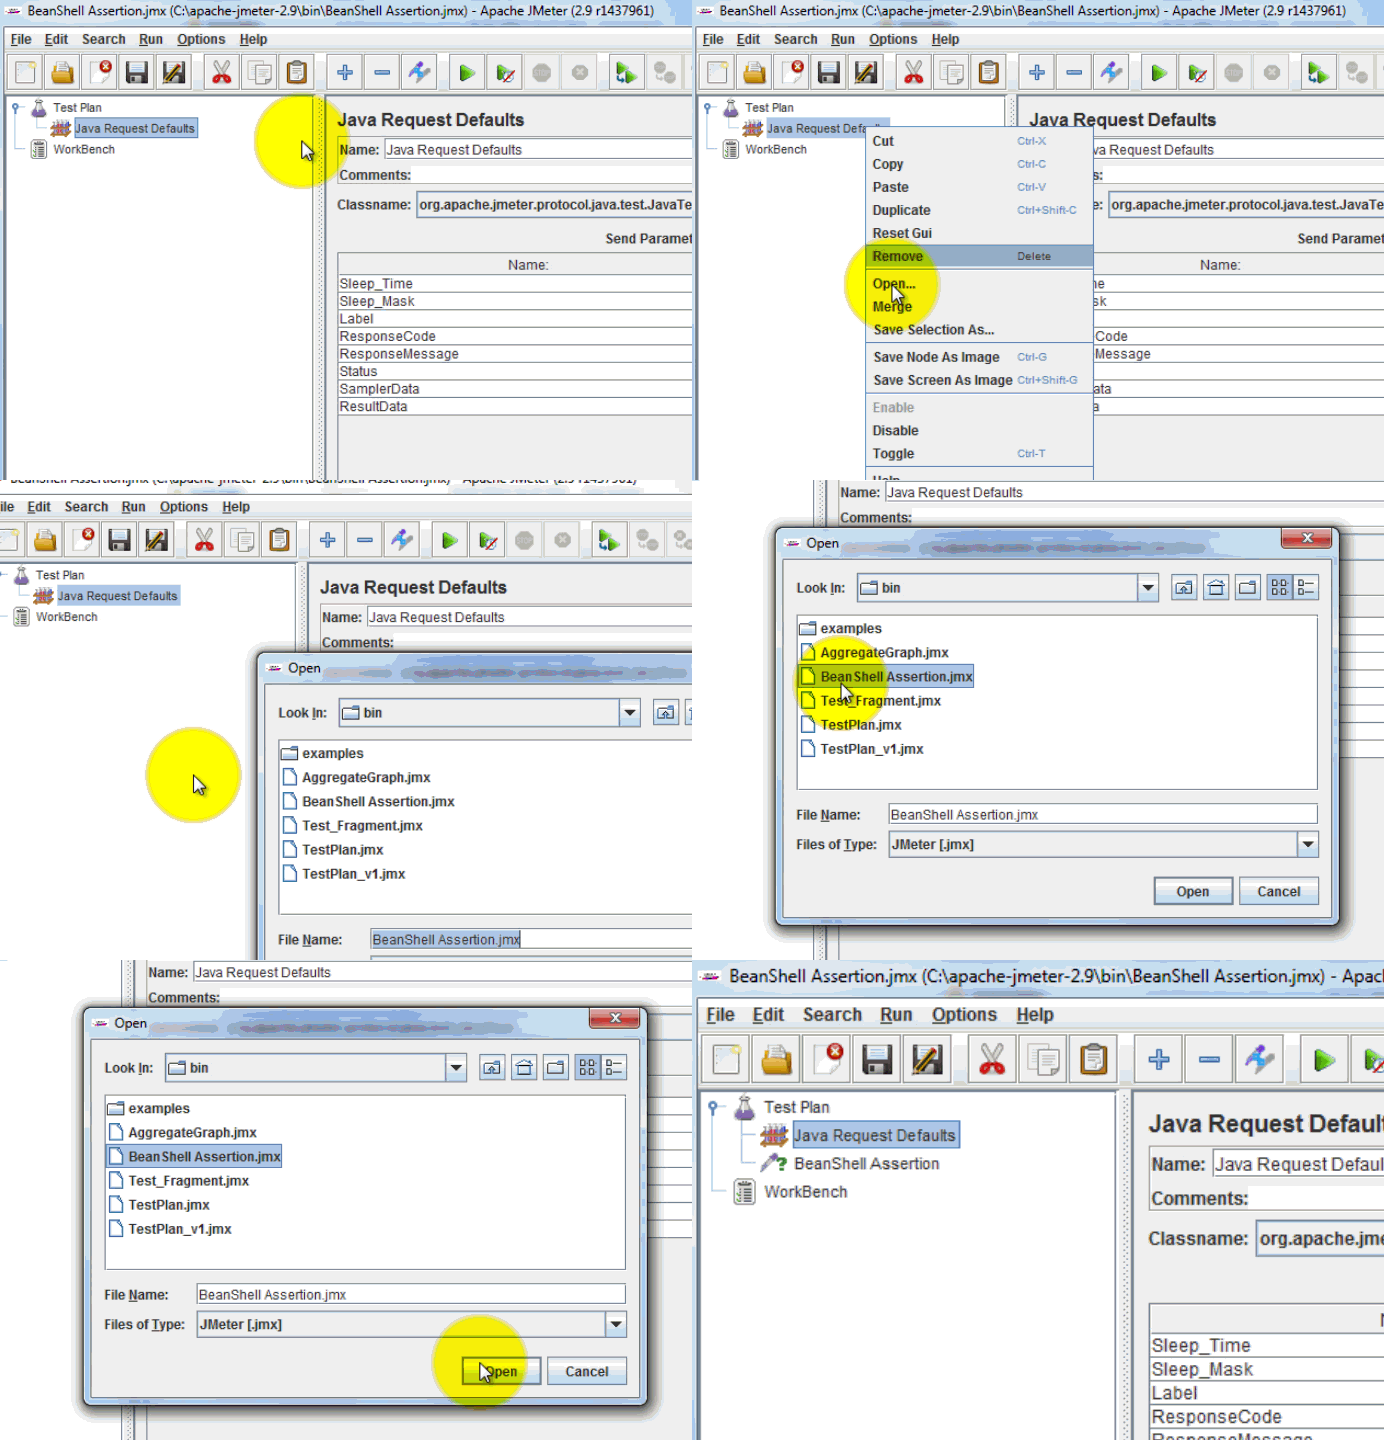
Choose the BeanShell Assertion.jmx file from the directory. The element is added to your current Test Plan, as shown below.

How to Configure Elements
Every element exposes its own settings. To configure one:
- Select the element in the tree on the left pane.
- Enter the configuration settings on the right pane.
The right-hand panel changes with each element type, as below.

How to Save a Test Plan
Save your Test Plan before running a test. Doing so protects your work against unexpected errors during the run. The steps are:
- File -> Save Test Plan As — a dialog box opens.
- Enter a filename for the Test Plan -> click Save.

Note: saving a Test Plan is different from saving an element.
| Saving a Test Plan | Saving an Element |
|---|---|
| A Test Plan consists of one or many elements | An element is a single basic component of JMeter |
| Saving the Test Plan writes every element in the plan | Saving an element writes only that one element |
| Reopened with File -> Open | Reopened with right-click -> Merge |
Create a Combo Test Plan
You can merge one or many saved Test Plans into a combo Test Plan, as shown in the figure below.
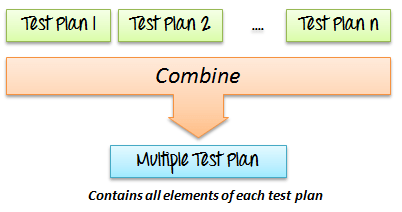
Suppose you have a Test Plan named Test_Fragment.jmx on your computer (this article includes the file). Merge it into the plan currently open in JMeter to build a larger one.

All the test elements from Test_Fragment.jmx are now added to your current Test Plan, as the figure below shows.

How to Run Test Plan
With the plan saved, you can execute it. To run one or more test plans, choose Start (Ctrl + R) from the Run menu.

While JMeter is running, a small green box appears at the right-hand end of the menu bar.

The numbers to the left of the green box are the number of active threads / total number of threads.
To stop the test, press the Stop button or use the shortcut Ctrl + ‘.’

Test Report
When execution finishes you can collect the test report: the error log saved as jmeter.log, plus the results file written by your listeners. Here is a typical jmeter.log startup excerpt:
2026/07/21 08:41:12 INFO o.a.j.JMeter: Copyright (c) 1998-2024 The Apache Software Foundation
2026/07/21 08:41:12 INFO o.a.j.JMeter: Version 5.6.3
2026/07/21 08:41:12 INFO o.a.j.JMeter: java.version=17.0.11
2026/07/21 08:41:12 INFO o.a.j.JMeter: java.vm.name=OpenJDK 64-Bit Server VM
2026/07/21 08:41:12 INFO o.a.j.JMeter: os.name=Windows 11
2026/07/21 08:41:12 INFO o.a.j.JMeter: os.arch=amd64
2026/07/21 08:41:12 INFO o.a.j.JMeter: file.encoding=UTF-8
2026/07/21 08:41:12 INFO o.a.j.JMeter: Default Locale=English (United States)
2026/07/21 08:41:12 INFO o.a.j.JMeter: JMeterHome=C:\apache-jmeter-5.6.3
2026/07/21 08:41:12 INFO o.a.j.JMeter: user.dir=C:\apache-jmeter-5.6.3\bin
Read jmeter.log first whenever a run misbehaves: it records the JMeter and Java versions, any element that failed to load, and every exception thrown. Current releases can also turn a results file into a browsable HTML dashboard of response-time, throughput and error-rate graphs.
