
Модель диаграммы Entity Relations (ER) с примером СУБД
 Редакционная коллегия
⚡ Умное резюме
Пример модели диаграммы «сущность-связь» (ER-диаграммы) с использованием СУБД. В статье представлен структурированный метод визуального представления данных и их взаимосвязей в реляционных базах данных. Предложенный Питером Ченом, он обеспечивает основу для концептуального моделирования, позволяющего точно определять сущности, атрибуты, отношения и их кардинальность.
Что такое ER-диаграмма?
Диаграмма «сущность-связь» (ER-диаграмма) — это мощный визуальный инструмент для проектирования структур реляционных баз данных. Впервые предложенная Питером Ченом в 1976 году, она обеспечивает концептуальную основу моделирования, которая точно определяет сущности, атрибуты, связи и их кардинальность. В этом руководстве рассматриваются все аспекты, от базовых понятий до продвинутых методов.ping Вы освоили проектирование схем баз данных.
Диаграммы ER содержат различные символы, в которых для представления сущностей используются прямоугольники, для определения атрибутов — овалы, а для представления связей — ромбы.
На первый взгляд, ER-диаграмма очень похожа на блок-схему. Однако ER-диаграмма включает в себя множество специализированных символов, и их значения делают эту модель уникальной. Цель ER-диаграммы — представить инфраструктуру Entity Framework.
История моделей ЭР
Питер Чен предложил ER-диаграмму в 1976 году в своей основополагающей работе «Сущность-связь: к единому представлению данных». Его целью было создание единой системы, которую можно было бы использовать как для реляционных баз данных, так и для сетей. Чен представлял ER-модель как концептуальный подход к моделированию, который позволил бы преодолеть разрыв между реальными требованиями и технической реализацией базы данных.
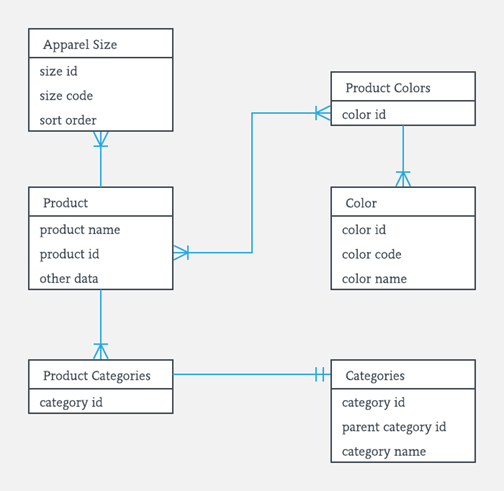
С тех пор модель ER развивалась, появились различные системы обозначений, включая нотацию Чена (оригинальная), нотацию «воронья лапка» (популярная в современных инструментах) и подходы на основе UML. Несмотря на эти вариации, основные концепции остаются неизменными во всех реализациях.
Зачем использовать ER-диаграммы?
ER-диаграммы предоставляют множество преимуществ при проектировании и разработке баз данных:
- Визуальная связь: Они обеспечивают наглядное визуальное представление, понятное как техническим, так и нетехническим заинтересованным сторонам.
- План развития: Они наглядно показывают, как должны быть связаны таблицы и какие поля будет содержать каждая таблица.
- Готово к переводу: ER-диаграммы можно напрямую преобразовать в реляционные таблицы, что позволяет быстро создавать базы данных.
- Предотвращение ошибок: Они помогают выявлять недостатки проектирования и избыточность до начала внедрения, экономя время и ресурсы.
- Документация: Они служат долговременной документацией, помогающей новым членам команды понять архитектуру системы.
- Системный анализ: Они помогают идентифицировать все сущности, существующие в системе, и взаимосвязи между ними.
Компоненты ER-диаграммы
Каждая ER-диаграмма строится из трех основных компонентов: сущностей, атрибутов и связей. Понимание каждого компонента и того, как они взаимодействуют, имеет важное значение для создания эффективных баз данных.
Примеры диаграмм ER
Например, в базе данных университета могут быть сущности «Студенты», «Курсы» и «Преподаватели». Сущность «Студент» может иметь такие атрибуты, как «Номер зачетной книжки», «Имя» и «Идентификатор отдела». Они могут быть связаны с сущностями «Курсы» и «Преподаватели».
Юридические лица
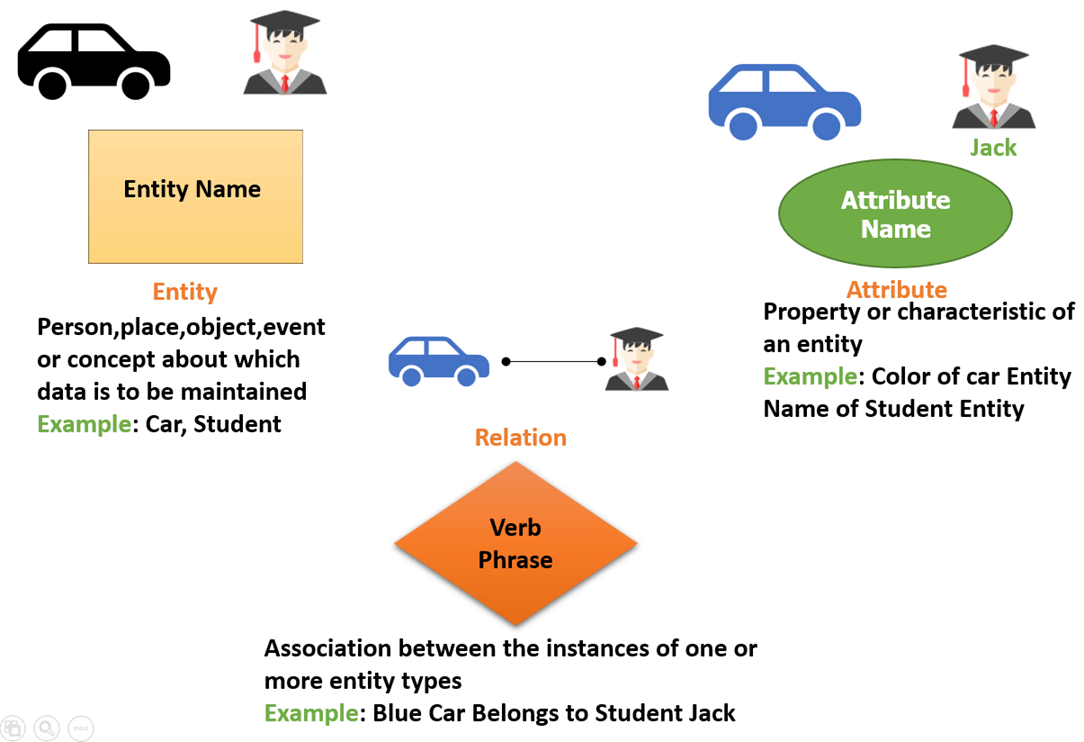
Сущность представляет собой любой реальный объект — живой или неживой — который можно четко идентифицировать и о котором можно хранить данные. Это может быть физический объект, факт, касающийся предприятия, или событие, происходящее в реальном мире. Сущности могут включать людей, места, объекты, события или понятия.
Примеры сущностей по категориям:
- Человек: Сотрудник, Студент, Пациент, Клиент
- Место проведения: Магазин, здание, офис, склад
- Объект: Машина, Продукт, Автомобиль, Книга
- Событие: Продажа, регистрация, продление, сделка
- Концепция: Учетная запись, Курс, Отдел, Проект

Набор объектов
Набор сущностей — это группа похожих сущностей, обладающих общими атрибутами. Например, все студенты университета образуют набор сущностей «Студент». В ER-диаграммах сущности представляются в виде прямоугольников, внутри которых указывается название сущности.
Сущности представляются своими свойствами, которые также называются атрибутами. Все атрибуты имеют свои отдельные значения. Например, сущность «студент» может иметь в качестве атрибутов имя, возраст и класс.
Сильные организации против слабых организаций
Сущности классифицируются как сильные или слабые в зависимости от их способности существовать независимо. Понимание этого различия имеет решающее значение для правильного проектирования баз данных.
Надежная сущность имеет собственный первичный ключ и может существовать независимо. Например, сущность «Студент» может быть однозначно идентифицирована по Student_ID без зависимости от какой-либо другой сущности.
Слабая сущность не имеет собственного первичного ключа и зависит от сильной сущности (называемой сущностью-владельцем) для своей идентификации. Она использует частичный ключ (дискриминатор) в сочетании с первичным ключом владельца для достижения уникальности. Например, в банковской системе сущность «Транзакция» зависит от сущности «Счет» — сам по себе номер транзакции не является уникальным во всей базе данных, но в сочетании с номером счета он становится уникальным.
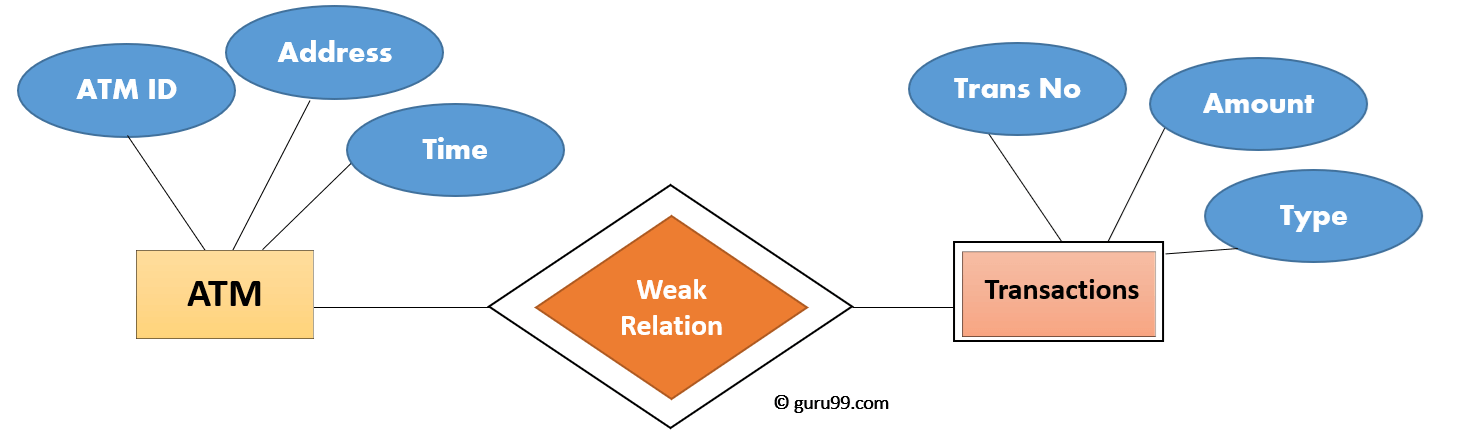
| Сильная сущность | Слабая сущность |
|---|---|
| Имеет собственный первичный ключ | Отсутствует первичный ключ; используется частичный ключ. |
| Представлен одним прямоугольником | Представлен двойным прямоугольником. |
| Основной ключ подчеркнут сплошной линией. | Часть легенды подчеркнута пунктирной линией. |
| Могут существовать независимо | Зависит от юридического лица-владельца для своего существования. |
| Связь с одним бриллиантом | Связан с двойным алмазом (идентифицирующая связь) |
| Пример: Студент, Сотрудник, Продукт | Пример: Transaction, Dependent, Order_Item |
Родство
Отношение представляет собой связь между двумя или более сущностями. Отношения обычно описываются с помощью глаголов или глагольных фраз, которые характеризуют взаимодействие сущностей друг с другом. В ER-диаграммах отношения изображаются в виде ромбов. Пример: Том работает в химическом отделе.
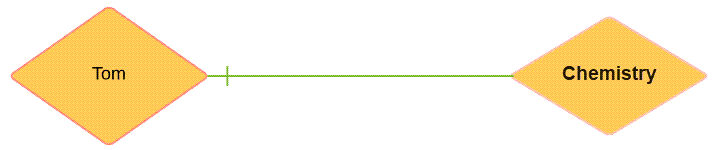
Сущности принимают участие в отношениях. Мы часто можем определить отношения с глаголами или глагольными фразами.
Примеры:
- Вы посещаете эту лекцию
- Я читаю лекцию
- Студент посещает лекцию
- Лектор читает лекцию.
Атрибуты
Атрибут — это свойство или характеристика, описывающая сущность или отношение. Атрибуты предоставляют подробную информацию, которая делает каждый экземпляр сущности уникальным и значимым. В ER-диаграммах атрибуты представляются с помощью овалов (эллипсов), соединенных с родительской сущностью линией.
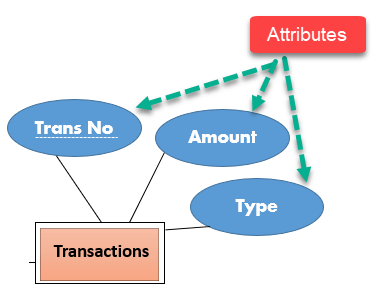
Например, сущность «Студент» может иметь такие атрибуты, как Student_ID, Name, Date_of_Birth, Email и Phone_Number.
Типы атрибутов
| Тип атрибута | Описание | Пример |
|---|---|---|
| Простой (AtomIC) | Не может быть далее разделен на более мелкие компоненты. | Номер телефона, номер социального страхования, адрес электронной почты |
| Композитный | Может быть разбит на более мелкие под-атрибуты. | ФИО (Имя, Отчество, Фамилия), Адрес (Улица, Город, Почтовый индекс) |
| Производный | Значение вычисляется на основе других атрибутов; оно не хранится напрямую. | Возраст (определяется по дате рождения), общая стоимость |
| Многозначный | Может содержать несколько значений для одной сущности. | Телефон NumbersАдреса электронной почты, навыки |
| Ключевой атрибут | Уникально идентифицирует каждый экземпляр сущности (первичный ключ). | Student_ID, Employee_ID, ISBN |
Ключевой совет: На ER-диаграммах ключевые атрибуты отображаются с подчеркнутыми названиями. Производные атрибуты отображаются пунктирными овалами, а многозначные атрибуты — двойными овалами.
Кардинальность (Типы отношений)
Мощность множества определяет числовые ограничения отношения — в частности, сколько экземпляров одной сущности может быть связано с экземплярами другой сущности. Понимание мощности множества имеет важное значение для проектирования эффективных структур баз данных.
1. Один на один (1:1)
Один объект из множества А может быть связан не более чем с одним объектом из множества В, и наоборот.
Пример: каждому студенту присваивается ровно один идентификационный номер, и каждый идентификационный номер принадлежит ровно одному студенту.

2. Один ко многим (1:N)
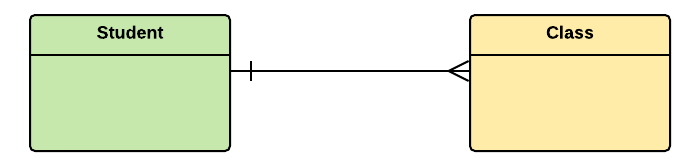
Одна сущность из множества A может быть связана с несколькими сущностями из множества B, но каждая сущность в множестве B связана только с одной сущностью в множестве A.
Пример: Один класс состоит из нескольких учеников.

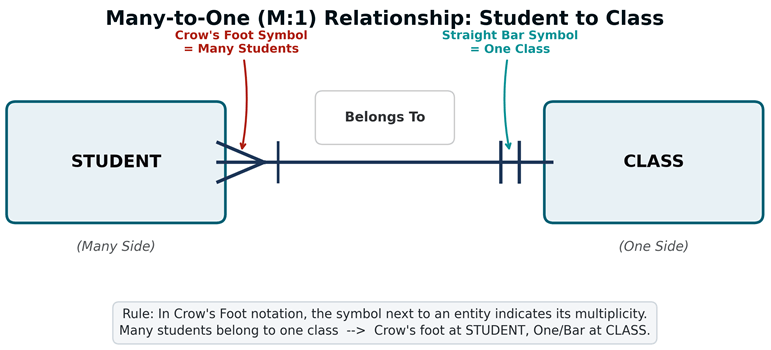
3. Многих к одному (N:1)
Несколько объектов из множества A могут быть связаны с одним объектом из множества B.
Например, многие ученики принадлежат к одному классу.
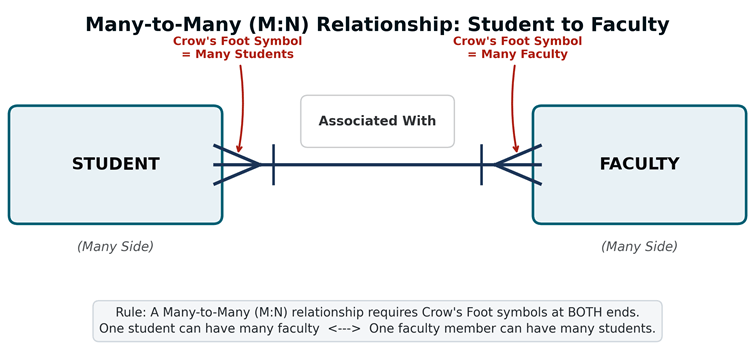
4. Связь «многие ко многим» (M:N)
Несколько объектов из множества A могут быть связаны с несколькими объектами из множества B, и наоборот.
Например, группа «Студенты» связана с несколькими преподавателями, а преподаватели могут быть связаны с несколькими студентами.
Символы и обозначения ER-диаграммы
В ER-диаграммах для представления различных компонентов используются стандартизированные символы. Хотя существует несколько систем обозначений, наиболее широко используются две: нотация Чена и нотация «воронья лапка».
Обозначения Чена
Нотация Чена, разработанная Питером Ченом в 1976 году, использует геометрические фигуры для представления различных элементов:
| Символ | Имя | Представляет |
|---|---|---|
| Прямоугольные | Сущность | Сильная сущность (например, студент, продукт) |
| Double Прямоугольные | Слабая сущность | Сущность зависит от другой сущности (например, транзакции). |
| Эллипс/Овал | Атрибут | Свойство объекта (например, имя, идентификатор) |
| Double Эллипс | Многозначный атрибут | Атрибут с несколькими значениями (например, Телефон). Numbers) |
| Пунктирный эллипс | Производный атрибут | Вычисленное значение (например, возраст по дате рождения) |
| Diamond | Родство | Взаимосвязь между объектами (например, регистрациями) |
| Double Diamond | Выявление взаимосвязи | Отношения со слабой сущностью |
| линия | Ссылка | Соединяет компоненты между собой |
| Подчеркнутый текст | Основной ключ | Уникальный идентификатор для сущности |
Обозначение «воронья лапка»
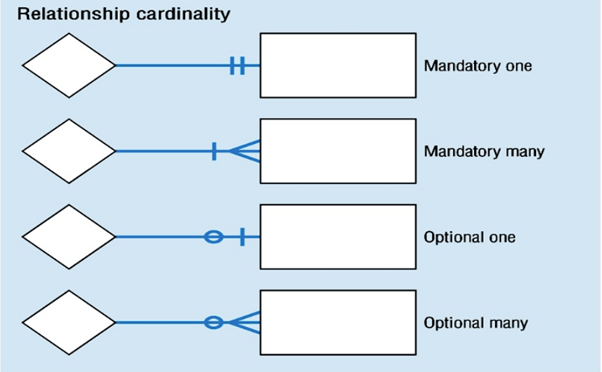
Нотация «воронья лапка» (также называемая нотацией IE) чаще используется в современных инструментах проектирования баз данных. Она использует разные символы конца строки для обозначения кардинальности и особенно эффективна для отображения «многосторонней» стороны отношений.
| Символ Descriptион | Смысл |
|---|---|
| Одиночная вертикальная линия (|) | Обязательно один (ровно один) |
| Круг с линией (O|) | Необязательный вариант: Один (ноль или один) |
| «Воронья лапка» с линией (>|) | Обязательное. Много (один или более). |
| «Воронья лапка» с кругом (>O) | Необязательно Много (ноль или более) |
Нотация Чена против «вороньей лапки»: когда использовать каждую из них?
| Аспект | Обозначения Чена | Обозначение «воронья лапка» |
|---|---|---|
| лучший для | Концептуальное моделирование, академическое применение | Физическое/логическое моделирование, применение в промышленности. |
| Отображение атрибутов | Визуально отображает все атрибуты. | Отображает атрибуты внутри блока сущности. |
| мощность | Использует числа (1, N, M) | Использует визуальные символы |
| Многогранность | Может стать захламленным | Более компактный и чистый |
| Поддержка инструментов | Ограниченная поддержка современных инструментов | Широко поддерживается в инструментах |
Как создать диаграмму отношений сущностей (ERD)
В этом уроке по созданию ER-диаграммы (ERD) мы научимся её создавать. Ниже описаны шаги по созданию ER-диаграммы:

Давайте изучим их на примере диаграммы отношений сущностей:
В университете студент записывается на курсы. Студенту должен быть назначен как минимум один курс. Каждый курс ведет один профессор. Для поддержания качества обучения профессор может вести только один курс.
Шаг 1) Идентификация объекта
У нас есть три сущности:
- "Студент"
- "Курс"
- Профессор

Шаг 2) Идентификация отношений
У нас существуют следующие два типа взаимоотношений:
- Студент назначенный курс
- Профессор обеспечивает курс

Шаг 3) Идентификация мощности
Из условия задачи известно, что:
- Студенту можно поручить с разными курсы
- Профессор может дать только one курс

Шаг 4) Определите атрибуты
Для выявления атрибутов необходимо изучить файлы, формы, отчеты и данные, которые в настоящее время хранятся в организации. Также можно провести интервью с различными заинтересованными сторонами для определения сущностей. На начальном этапе важно определить атрибуты без составления карты.ping их к конкретному объекту.
Получив список атрибутов, необходимо сопоставить их с указанными сущностями. Убедитесь, что атрибут должен быть связан ровно с одной сущностью. Если вы считаете, что атрибут должен принадлежать более чем одной сущности, используйте модификатор, чтобы сделать его уникальным.
Когда-то картаping После этого определите первичные ключи. Если уникальный ключ недоступен, создайте его.
| Сущность | Основной ключ | Атрибут |
|---|---|---|
| "Студент" | Студенческий билет | Имя студента |
| Профессор | ID_сотрудника | Имя профессора |
| "Курс" | Идентификатор_курса | Название курса |

Для сущности «Курс» атрибутами могут быть продолжительность, количество кредитов, количество заданий и т. д. Для простоты мы рассмотрели только один атрибут.
Шаг 5) Создайте ERD-диаграмму.
Более современное представление диаграммы «сущность-связь»:

лучшие практики создания эффективных ER-диаграмм
Следуйте этим рекомендациям для создания понятных, поддерживаемых и эффективных ER-диаграмм:
- Устранить избыточность: Удалите повторяющиеся сущности, атрибуты или связи.
- Используйте четкие соглашения об именовании: Используйте единообразные, описательные названия. Избегайте сокращений.
- Проверка на соответствие требованиям: Убедитесь, что диаграмма поддерживает все потребности в хранении данных.
- Будь проще: Создавайте несколько диаграмм на разных уровнях, а не одну загроможденную диаграмму.
- Используйте цвет экономно: Используйте цвета последовательно для выделения категорий.
- Предположения, изложенные в документе: Включите пояснения, объясняющие предположения относительно бизнес-правил.
- RevВстреча с заинтересованными сторонами: Предложите бизнес-пользователям и технической команде проверить диаграмму.
- Контроль версий: Сохраняйте версии по мере развития дизайна.
ER-диаграммы против диаграмм классов UML
Хотя и ER-диаграммы, и UML-диаграммы классов используются для моделирования данных, они служат разным целям и контекстам. Понимание того, когда следует использовать каждую из них, важно для эффективного проектирования системы.
| Аспект | Диаграмма ER | Схема классов UML |
|---|---|---|
| Основная цель | Дизайн базы данных | Проектирование программного обеспечения/объектного дизайна |
| Фокус | Данные и взаимоотношения | Объекты, методы и модели поведения |
| Методы/Operaных | Не поддерживается | Полностью поддерживается |
| наследование | Ограничено (только в рамках EER) | Полная поддержка |
| Промышленное использование | Администраторы баз данных, аналитики данных | Разработчики программного обеспечения, архитекторы |
