
Nagios Підручник: Що таке Nagios Інструмент? Archiтектура та встановлення
 Редакційна колегія
⚡ Розумний підсумок
Nagios — це платформа моніторингу з відкритим кодом, яка постійно відстежує сервери, мережі, програми та сервіси, попереджаючи команди про збої в режимі реального часу, щоб проблеми швидко вирішувалися в усій DevOps-інфраструктурі.
Nagios є одним із найпоширеніших інструментів з відкритим кодом для безперервного моніторингу ІТ-інфраструктури. У цьому посібнику пояснюється, що Nagios як працює його клієнт-серверна архітектура та плагіни, як його встановити на AWS та де він вписується в сучасний DevOps робочий процес.
Що таке постійний моніторинг?
Безперервний моніторинг — це практика виявлення, звітування та реагування на кожну проблему чи атаку, що виникає в інфраструктурі. Після розгортання програми на сервері безперервний моніторинг бере на себе завдання спостереження за системами компанії та відповідного реагування. Він доповнює інструменти безперервної інтеграції, такі як Jenkins шляхом поширення автоматизованого контролю на виробництво.
Що таке Nagios?
Nagios — це програмне забезпечення з відкритим вихідним кодом для безперервного моніторингу систем, мереж та інфраструктур. Воно запускає плагіни, які зберігаються на сервері та підключені до хоста або іншого сервера у вашій мережі чи Інтернеті. Щоразу, коли виникає збій, Nagios піднімає сповіщення, щоб технічна команда могла негайно розпочати процес відновлення.
Оскільки він цілодобово стежить за системами, програмами, сервісами та бізнес-процесами, Nagios є популярним вибором для безперервного моніторингу в культурі DevOps.
Навіщо нам це потрібно Nagios?
Ось важливі причини використовувати Nagios інструмент моніторингу:
- Виявляє всі типи проблем з мережею та сервером.
- Допомагає знайти першопричину проблеми, щоб ви могли застосувати постійне рішення.
- Активно контролює всю вашу інфраструктуру та бізнес-процеси.
- Дозволяє відстежувати та усувати проблеми з продуктивністю сервера.
- Допомагає вам планувати оновлення інфраструктури до того, як застарілі системи призведуть до збоїв.
- Допомагає вам підтримувати безпеку та доступність ваших послуг.
- Може автоматично вирішувати проблеми в критичних ситуаціях.
історія Nagios
1996 – Ітан Галстад створює просту програму для MS-DOS, яка «ping«сервери Novell NetWare та надсилають числові сторінки. Базова архітектурна концепція, яка пізніше використовувалася для Nagios народжується.
1998 – Ітан використовує ідеї та архітектуру своїх попередніх робіт, щоб розпочати створення нового застосунку, який працює на ОС Linux.
1999 – Проєкт випущено як програмне забезпечення з відкритим вихідним кодом під назвою «NetSaint». Плагіни, спочатку розповсюджені як частина дистрибутива NetSaint, незабаром розділені на окремий Nagios Проект плагінів.
2002 – Ітан перейменовує проєкт на «Nagios» через проблеми з товарним знаком із назвою «NetSaint».
2005 - Nagios стає SourceForgeПроект місяця .net у червні.
2007 – Ітан засновує Nagios ТОВ «Ентерпрайзес» надає консалтингові та розробницькі послуги. Nagios.
2009 - Nagios Enterprises випускає свою першу комерційну версію, Nagios XIПроєкт з відкритим кодом перейменовано. Nagios Основний
2010 - Nagios Fusion випущено як центральну панель інструментів для кількох серверів моніторингу.
2013 - Nagios Випущено Core 4 разом із Nagios Network Analyzer та кросплатформний агент NCPA.
2014 - Nagios Випущено Log Server для моніторингу та керування журналами підприємства.
2015 - Nagios XI 5 виходить з понад 200 покращеннями та доповненнями.
2016 - Nagios Кількість завантажень Core перевищує 7 500 000 безпосередньо з SourceForgeВебсайт .net.
2017 - Nagios Випущено Log Server 2, і Nagios перевищує 1,200 завантажень програмного забезпечення на день.
2019 – Ітан Галстад йде з посади генерального директора Nagios Підприємства та наймає наступника.
2022 – Ітан Галстад відновлює свою посаду генерального директора.
2023 – Версії 2024R1 Nagios XI, Сервер журналів, Network Analyzer, а Fusion випускаються зі значними оновленнями для кожного продукту.
2024 - Nagios Підприємство святкує своє 25-річчя та Nagios XI його 15-те. Nagios Ядро перевищує 8 500 000 SourceForgeзавантаження .net, Nagios Сайт бібліотеки перезапущено, і перша версія Nagios Платформа основних послуг (CSP) постачається спільноті.
2025 – Шостий Nagios Всесвітня конференція проводиться в штаб-квартирі компанії в Сент-Полі, штат Міннесота. Nagios повідомляє про понад 10 000 клієнтів та зростає до 100 співробітників. Nagios Log Server 2026 постачається з новою головною сторінкою Simple Search та оновленням до OpenSeaверсія 3.1.0.
2026 - Nagios Core 4.5.x продовжує випускати релізи з обслуговування та підвищення безпеки (4.5.11 у січні, 4.5.13 у травні), водночас Nagios XI переходить до серії 2026R1 з новими майстрами налаштування для Red Hat OpenShift. Nagios Всесвітня конференція 2026 року запланована на 14–17 вересня в Сент-Полі, штат Міннесота.
Особливості Nagios
Нижче наведено важливі характеристики Nagios інструмент моніторингу:
- Відносно масштабований, керований та безпечний.
- Забезпечує хорошу систему журналів та баз даних.
- Пропозиції інформативні та за адресоюtracтивні веб-інтерфейси.
- Автоматично надсилає сповіщення, коли стан змінюється.
- Пропускає зайві перевірки, коли служби вже працюють нормально.
- Допомагає виявляти мережеві помилки та збої сервера.
- Дозволяє вирішувати проблеми з продуктивністю сервера.
- Автоматично виправляє проблеми, що виявляються під час моніторингу.
- Моніторингує весь ваш бізнес-процес та ІТ-інфраструктуру за один прохід.
- Використовує архітектуру, яка дозволяє легко писати нові плагіни мовою програмування на ваш вибір.
- Зчитує свою конфігурацію з усього каталогу, helping ви вирішуєте, як визначати окремі файли.
- Використовує топологію для визначення залежностей хоста.
- Моніторинг мережевих служб, таких як HTTP, SMTP, SNMP, FTP, SSH та POP.
- Допомагає визначити ієрархію мережевих хостів за допомогою батьківських хостів.
- Дозволяє визначити обробники подій, які запускаються під час подій служби або хоста для проактивного вирішення проблем.
- Підтримує реалізацію резервних хостів моніторингу.
Nagios Archiтектура
Nagios використовує архітектуру клієнт-сервер. У типовій мережі Nagios Сервер працює на хості, тоді як плагіни працюють на всіх віддалених хостах, які потрібно контролювати.
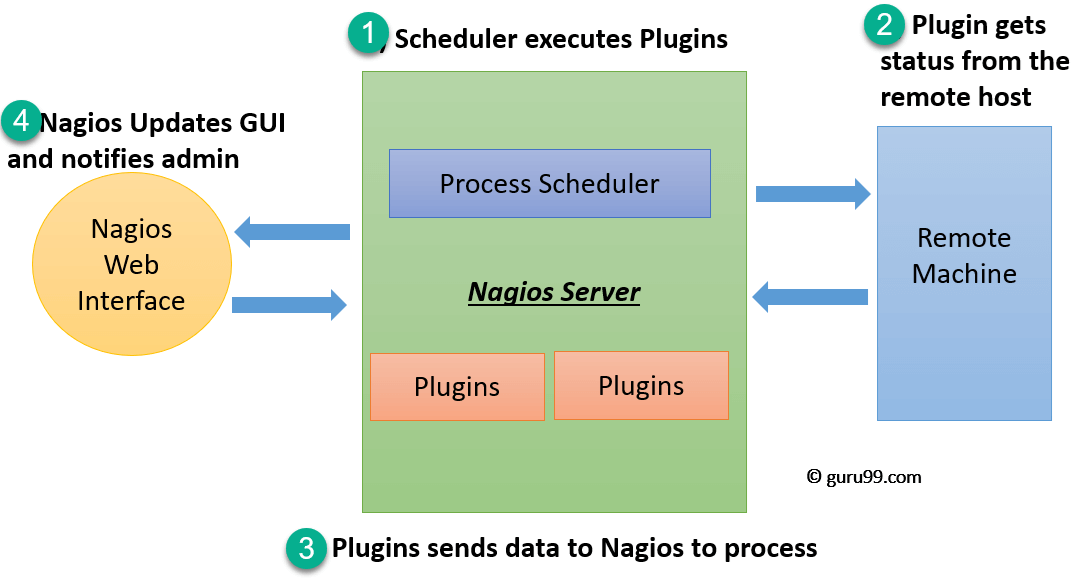
- Планувальник є компонентом серверної частини NagiosВін надсилає сигнал для виконання плагінів на віддаленому хості.
- Плагін отримує статус від віддаленого хоста.
- Плагін надсилає дані назад до планувальника процесів.
- Планувальник процесів оновлює графічний інтерфейс, а адміністраторам надсилаються сповіщення.
Плагіни
Nagios плагіни надають низькорівневий інтелект, який повідомляє Nagios Основне пояснення, як контролювати майже все. Плагін діє як окремий додаток, але він розроблений для виконання... Nagios Ядро. Він підключається до Apache, який контролюється CGI для відображення результату, тоді як підключена база даних зберігає файли журналів.
Як працюють плагіни?

Розглянемо наведений вище приклад:
- Check_nt — це плагін, який використовується для моніторингу Windows комп’ютера, і зазвичай він доступний на сервері моніторингу.
- NSClient++ слід встановити на кожному Windows машина, яку ви хочете контролювати.
- SSL-з'єднання між сервером і хостом забезпечує безперервний обмін інформацією між ними.
Аналогічно, NRPE (Nagios Плагіни Remote Plugin Executor) та NSCA використовуються для моніторингу хостів Linux та Mac OS X відповідно.
графічний інтерфейс користувача
Команда Nagios Інтерфейс відображає веб-сторінки, згенеровані за допомогою CGI. Він може відображати стан за допомогою кольорових кнопок (зелених або червоних), звуків, графіків тощо.
Коли неодноразово спрацьовує легке сповіщення, воно стає важким сповіщенням, і Nagios потім сервер надсилає сповіщення адміністратору.

Як встановити Nagios Інструмент в AWS
Крок 1) Підписуватися на Nagios.
Перейдіть до Nagios лістинг на AWS Marketplace і натисніть «Продовжити підписку».

Крок 2) Прочитайте умови та положення, а потім прийміть їх.

Крок 3) Перегляньте повідомлення. Ви побачите повідомлення про очікування підписки.

Крок 4) Виконайте налаштування. Оновіть сторінку через кілька хвилин і натисніть «Продовжити налаштування».

Крок 5) Запуск NagiosЗалиште налаштування за замовчуванням і натисніть «Продовжити для запуску».

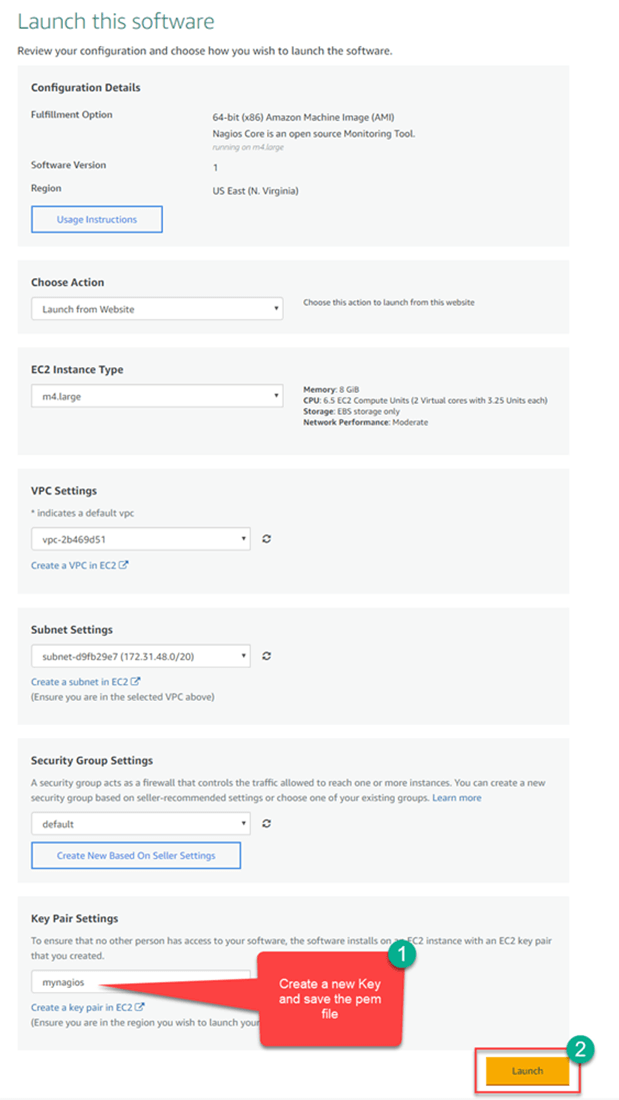
Крок 6) RevПерегляньте налаштування, створіть новий ключ і натисніть кнопку «Запустити».
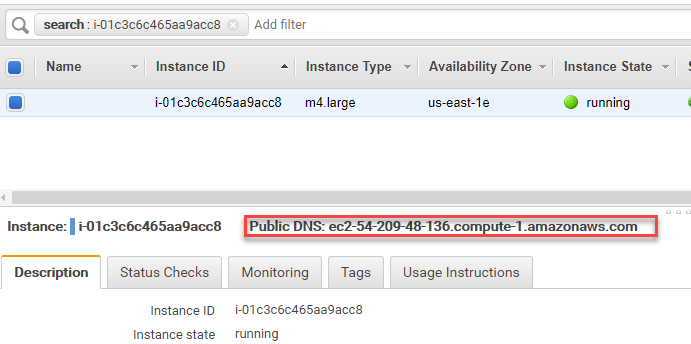
Крок 7) Зверніть увагу на публічний DNS вашого екземпляра.
Крок 8) Конвертуйте файл pem у ppk. На вашому Windows На машині скористайтеся генератором PuTTY, щоб конвертувати pem-файл у ppk-файл.

Крок 9) У PuTTY введіть публічний DNS.
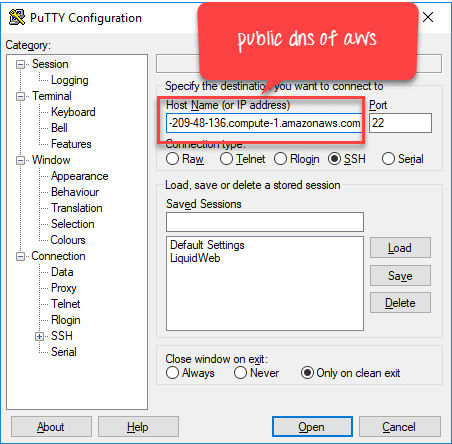
Крок 10) У розділі «Авторизація» введіть ключ ppk і натисніть «Відкрити».

Крок 11) У терміналі введіть ім'я користувача ubuntu та виконайте команду.
- Виконайте цю команду: sudo htpasswd -c /etc/nagios3/htpasswd.users nagiosadmin
- Введіть новий пароль на ваш вибір.

Крок 12) Відкрийте браузер і перейдіть за адресою http:// /nagios3 (у цьому прикладі, http://ec2-54-209-48-136.compute-1.amazonaws.com/nagios3/).
Введіть ім'я користувача: nagiosadmin
Пароль: той, що був встановлений на попередньому кроці.
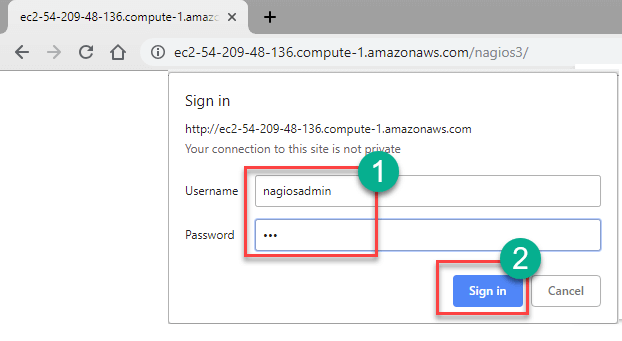
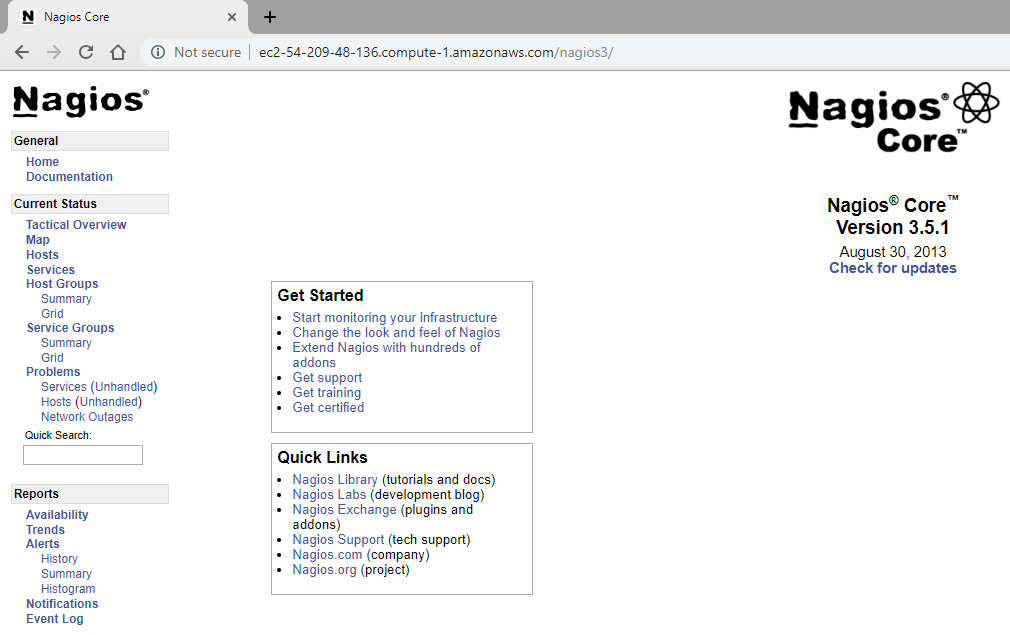
Крок 13) Команда Nagios встановлення виконано, і Nagios вантажі
Застосування Nagios
Команда Nagios інструмент моніторингу мережі це система перевірки та моніторингу справності типового центру обробки даних, що охоплює всі типи обладнання, такі як:
- Сервери та мережеві вузли.
- Моніторинг програм з однієї консолі.
- Моніторинг застосунків з аналітикою на рівні транзакцій.
- Компоненти проміжного програмного забезпечення та обміну повідомленнями.
- Налаштовувані звіти та інформаційні панелі.
- Системи резервного живлення від джерел безперебійного живлення (ДБЖ).
- Біометричні системи ідентифікації.
- Системи контролю температури та вологості (датчики).
- Системи відеоспостереження та відеореєстратора.
- Підсистеми зберігання даних (NAS та SAN).
Недоліки використання Nagios
- Важливі функції, такі як майстри та інтерактивні панелі інструментів, доступні лише в Nagios XI, що є досить дорогим інструментом.
- Nagios Core має заплутаний інтерфейс для нових користувачів.
- Він використовує багато файлів конфігурації, які може бути важко налаштувати.
- Nagios не може контролювати пропускну здатність мережі.
- Цей інструмент дозволяє контролювати мережу, але не керувати нею.
- Nagios не розрізняє такі пристрої, як сервери, маршрутизатори чи комутатори, оскільки кожен пристрій розглядається як хост.
